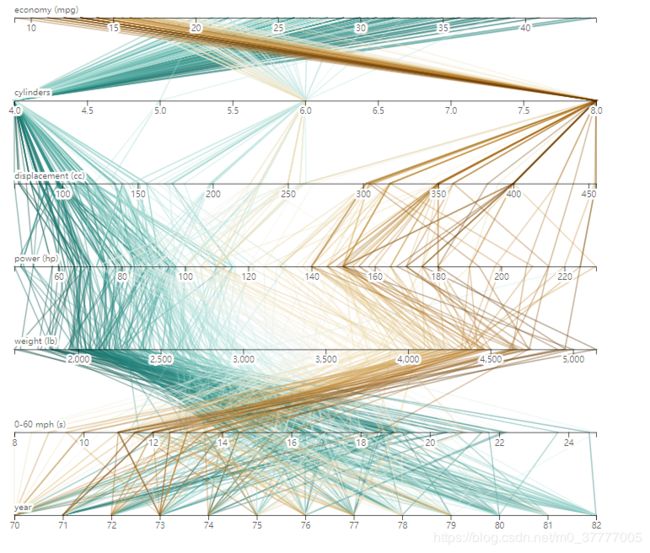
先看运行截图吧

数据结构
[
{
"name": "AMC Ambassador Brougham",
"economy (mpg)": 13,
"cylinders": 8,
"displacement (cc)": 360,
"power (hp)": 175,
"weight (lb)": 3821,
"0-60 mph (s)": 11,
"year": 73
},
]
import * as d3 from 'd3';
export default function parallerChart(id, data, index = 0) {
(() => {
d3.select(id)
.selectAll('svg')
.remove();
})();
const width = 800;
const keys = [
'economy (mpg)',
'cylinders',
'displacement (cc)',
'power (hp)',
'weight (lb)',
'0-60 mph (s)',
'year',
];
const keyz = keys[index];
const height = keys.length * 90 || 700;
const margin = { top: 20, right: 10, bottom: 20, left: 100 };
const x = new Map(
Array.from(keys, key => [
key,
d3.scaleLinear(d3.extent(data, d => d[key]), [margin.left, width - margin.right]),
])
);
const y = d3.scalePoint(keys, [margin.top, height - margin.bottom]);
const z = d3.scaleSequential(
x
.get(keyz)
.domain()
.reverse(),
d3.interpolateBrBG
);
const svg = d3
.select(id)
.append('svg')
.attr('width', width)
.attr('height', height);
svg
.append('g')
.attr('fill', 'none')
.attr('stroke-width', 1.5)
.selectAll('path')
.data(data.slice().sort((a, b) => d3.ascending(a[keyz], b[keyz])))
.join('path')
.attr('stroke', d => z(d[keyz]))
.attr('stroke-opacity', 0.4)
.attr('d', d =>
d3
.line()
.defined(([, value]) => value != null)
.x(([key, value]) => x.get(key)(value))
.y(([key]) => y(key))(d3.cross(keys, [d], (key, a) => [key, a[key]]))
)
.append('title')
.text(d => d.name);
svg
.append('g')
.selectAll('g')
.data(keys)
.join('g')
.attr('transform', d => `translate(0,${y(d)})`)
.each(function(d) {
d3.select(this).call(d3.axisBottom(x.get(d)));
})
.call(g =>
g
.append('text')
.attr('x', margin.left)
.attr('y', -6)
.attr('text-anchor', 'start')
.attr('fill', 'currentColor')
.text(d => d)
)
.call(g =>
g
.selectAll('text')
.clone(true)
.lower()
.attr('fill', 'none')
.attr('stroke-width', 5)
.attr('stroke-linejoin', 'round')
.attr('stroke', 'white')
);
}
