爬遍拉钩,带你看看数据分析师的真实现状
导包和数据
In [2]:
import pandas as pd
import numpy as np
import seaborn as sns
from pyecharts.charts import Pie
from pyecharts import options as opts
import matplotlib.pyplot as plt
%matplotlib inline
sns.set_style('white',{'font.sans-serif':['simhei','Arial']})
pd.set_option("display.max_column", None)
pd.set_option("display.max_row",None)
In [3]:
path = "./data/lagou.csv"
df = pd.read_csv(path)
In [4]:
df.columns
Out[4]:
Index(['Unnamed: 0', '_id', 'adWord', 'appShow', 'approve', 'businessZones',
       'city', 'companyFullName', 'companyId', 'companyLabelList',
       'companyLogo', 'companyShortName', 'companySize', 'createTime',
       'deliver', 'district', 'education', 'explain', 'financeStage',
       'firstType', 'formatCreateTime', 'gradeDescription', 'hitags',
       'imState', 'industryField', 'industryLables', 'isHotHire',
       'isSchoolJob', 'jobNature', 'lastLogin', 'latitude', 'linestaion',
       'longitude', 'pcShow', 'plus', 'positionAdvantage', 'positionId',
       'positionLables', 'positionName', 'promotionScoreExplain',
       'publisherId', 'resumeProcessDay', 'resumeProcessRate', 'salary',
       'score', 'secondType', 'skillLables', 'stationname', 'subwayline',
       'thirdType', 'workYear', 'job_detail'],
      dtype='object')
In [4]:
# 取出我们进行后续分析所需的字段
columns = ["positionName", "companyShortName", "city", "companySize", "education", "financeStage",
           "industryField", "salary", "workYear", "hitags", "companyLabelList", "job_detail"]
df = df[columns].drop_duplicates() #去重
分析目标
- 各城市对数据分析岗位的需求情况
- 不同细分领域对数据分析岗的需求情况
- 数据分析岗位的薪资状况
- 工作经验与薪水的关系
- 公司都要求什么掌握什么技能
- 岗位的学历要求高吗
- 不同规模的企业对工资经验的要求以及提供的薪资水平
数据清洗
去掉非数据分析岗的数据
In [5]:
# 原始数据长度
len(df)
Out[5]:
2939In [6]:
# 数据分析相应的岗位数量
cond_1 = df["positionName"].str.contains("数据分析")  # 职位名中含有数据分析字眼的
cond_2 = ~df["positionName"].str.contains("实习")  # 剔除掉带实习字眼的
len(df[cond_1 & cond_2]["positionName"])
Out[6]:
1326In [7]:
# 筛选出我们想要的字段,并剔除positionName
df = df[cond_1 & cond_2]
df.drop(["positionName"], axis=1, inplace=True)
df.reset_index(drop=True, inplace=True)
将拉勾网的薪水转化为数值
拉勾网爬取下来的薪水是一个区间,这里用薪水区间的均值作为相应职位的薪水
In [8]:
# 处理过程
#1、将salary中的字符串均小写化(因为存在8k-16k和8K-16K)
#2、运用正则表达式提取出薪资区间
#3、将提取出来的数字转化为int型
#4、取区间的平均值
df["salary"] = df["salary"].str.lower()\
               .str.extract(r'(\d+)[k]-(\d+)k')\
               .applymap(lambda x:int(x))\
               .mean(axis=1)
从job_detail中提取出技能要求
将技能分为以下几类:
- Python/R
- SQL
- Tableau
- Excel
处理方式:
如果job_detail中含有上述四类,则赋值为1,不含有则为0
In [9]:
df["job_detail"] = df["job_detail"].str.lower().fillna("")  #将字符串小写化,并将缺失值赋值为空字符串

df["Python/R"] = df["job_detail"].map(lambda x:1 if ('python' in x) or ('r' in x) else 0)
df["SQL"] = df["job_detail"].map(lambda x:1 if ('sql' in x) or ('hive' in x)  else 0)
df["Tableau"] = df["job_detail"].map(lambda x:1 if 'tableau' in x  else 0)
df["Excel"] = df["job_detail"].map(lambda x:1 if 'excel' in x  else 0)
In [10]:
df.head(1)
Out[10]:
| companyShortName | city | companySize | education | financeStage | industryField | salary | workYear | hitags | companyLabelList | job_detail | Python/R | SQL | Tableau | Excel | |
|---|---|---|---|---|---|---|---|---|---|---|---|---|---|---|---|
| 0 | 达达-京东到家 | 北京 | 2000人以上 | 本科 | D轮及以上 | 消费生活 | 22.5 | 3-5年 | ['免费班车', '新婚红包', '定期调薪', '电脑补贴', '生子红包', '地铁周边... | ['年底双薪', '绩效奖金', '岗位晋升', '定期体检'] | 1 、负责o2o电商日常运营数据的统计, 监控, 梳理指标体系;||2、基于海量用户行为数据... | 1 | 1 | 0 | 1 |
处理行业信息
In [10]:
def clean_industry(industry):
    industry = industry.split(",")
    if industry[0]=="移动互联网" and len(industry)>1:
        return industry[1]
    else:
        return industry[0]

df["industryField"] = df.industryField.map(clean_industry)
数据分析
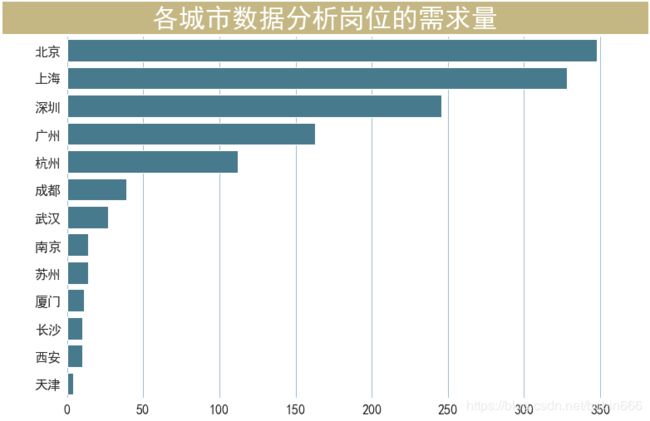
各城市对数据分析岗位的需求量
In [11]:
fig, ax = plt.subplots(figsize=(12,8))
sns.countplot(y="city",order= df["city"].value_counts().index,data=df,color='#3c7f99')
plt.box(False)
fig.text(x=0.04, y=0.90, s='           各城市数据分析岗位的需求量           ',
         fontsize=32, weight='bold', color='white', backgroundcolor='#c5b783')
plt.tick_params(axis='both', which='major', labelsize=16)
ax.xaxis.grid(which='both', linewidth=0.5, color='#3c7f99')
plt.xlabel('')
plt.ylabel('')
Out[11]:
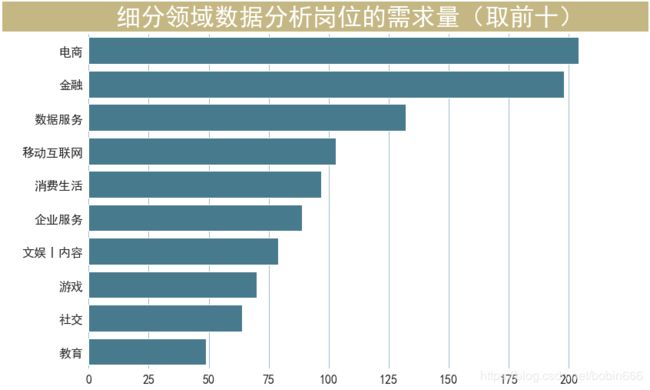
Text(0, 0.5, '')不同细分领域对数据分析岗的需求量
In [12]:
industry_index = df["industryField"].value_counts()[:10].index
industry =df.loc[df["industryField"].isin(industry_index),"industryField"]
In [13]:
fig, ax = plt.subplots(figsize=(12,8))
sns.countplot(y=industry.values,order = industry_index,color='#3c7f99')
plt.box(False)
fig.text(x=0, y=0.90, s='         细分领域数据分析岗位的需求量(取前十)     ',
         fontsize=32, weight='bold', color='white', backgroundcolor='#c5b783')
plt.tick_params(axis='both', which='major', labelsize=16)
ax.xaxis.grid(which='both', linewidth=0.5, color='#3c7f99')
plt.xlabel('')
plt.ylabel('')
Out[13]:
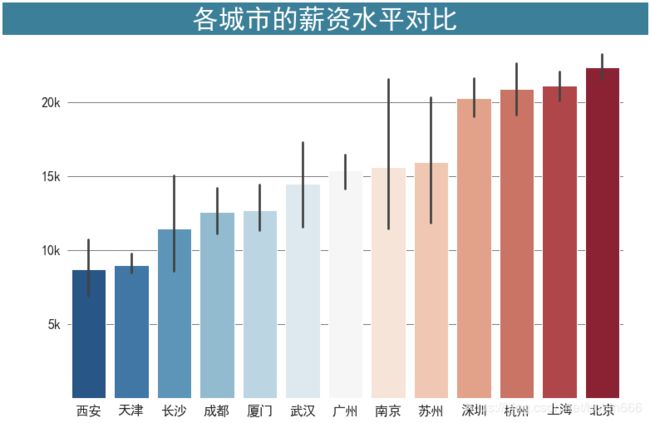
Text(0, 0.5, '')各城市相应岗位的薪资状况
In [14]:
fig,ax = plt.subplots(figsize=(12,8))
city_order = df.groupby("city")["salary"].mean()\
               .sort_values()\
               .index.tolist()
sns.barplot(x="city", y="salary", order=city_order, data=df, ci=95,palette="RdBu_r")
fig.text(x=0.04, y=0.90, s='              各城市的薪资水平对比              ',
         fontsize=32, weight='bold', color='white', backgroundcolor='#3c7f99')
plt.tick_params(axis="both",labelsize=16,)
ax.yaxis.grid(which='both', linewidth=0.5, color='black')
ax.set_yticklabels([" ","5k","10k","15k","20k"])
plt.box(False)
plt.xlabel('')
plt.ylabel('')
Out[14]:
Text(0, 0.5, '')In [15]:
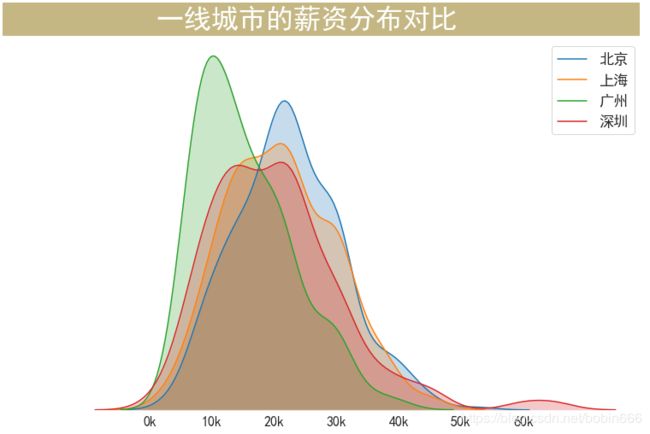
fig,ax = plt.subplots(figsize=(12,8))
fig.text(x=0.04, y=0.90, s='           一线城市的薪资分布对比             ',
         fontsize=32, weight='bold', color='white', backgroundcolor='#c5b783')
sns.kdeplot(df[df["city"]=='北京']["salary"],shade=True,label="北京")
sns.kdeplot(df[df["city"]=='上海']["salary"],shade=True,label="上海")
sns.kdeplot(df[df["city"]=='广州']["salary"],shade=True,label="广州")
sns.kdeplot(df[df["city"]=='深圳']["salary"],shade=True,label="深圳")
plt.tick_params(axis='both', which='major', labelsize=16)
plt.box(False)
plt.xticks(np.arange(0,61,10), [str(i)+"k" for i in range(0,61,10)])
plt.yticks([])
plt.legend(fontsize = 'xx-large',fancybox=None)
Out[15]:
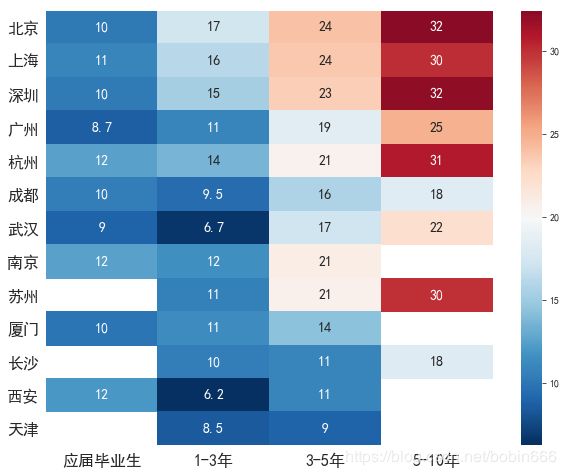
工作经验与薪水的关系
In [16]:
corr = df.pivot_table(index="city",columns="workYear",values="salary")
In [17]:
corr = corr[["应届毕业生","1-3年","3-5年","5-10年"]]
In [18]:
corr.loc[city_order]
Out[18]:
| workYear | 应届毕业生 | 1-3年 | 3-5年 | 5-10年 |
|---|---|---|---|---|
| city | ||||
| 西安 | 12.000000 | 6.250000 | 11.000000 | NaN |
| 天津 | NaN | 8.500000 | 9.000000 | NaN |
| 长沙 | NaN | 10.500000 | 11.000000 | 18.250000 |
| 成都 | 10.500000 | 9.500000 | 15.833333 | 18.333333 |
| 厦门 | 10.000000 | 11.375000 | 14.400000 | NaN |
| 武汉 | 9.000000 | 6.666667 | 17.300000 | 22.250000 |
| 广州 | 8.727273 | 10.915094 | 18.508621 | 24.800000 |
| 南京 | 12.500000 | 11.625000 | 21.000000 | NaN |
| 苏州 | NaN | 10.583333 | 20.750000 | 30.000000 |
| 深圳 | 10.333333 | 15.268116 | 23.400000 | 32.181818 |
| 杭州 | 12.500000 | 13.619048 | 20.612245 | 30.900000 |
| 上海 | 11.038462 | 16.268868 | 23.722628 | 30.097826 |
| 北京 | 10.190476 | 17.361111 | 24.008475 | 32.446809 |
In [19]:
fig,ax = plt.subplots(figsize=(10,8))
sns.heatmap(corr.loc[df["city"].value_counts().index],cmap="RdBu_r",center=20,annot=True,annot_kws={'fontsize':14})
plt.tick_params(axis='x', which='major', labelsize=16)
plt.tick_params(axis='y', which='major', labelsize=16,labelrotation=0)
plt.xlabel(""),plt.ylabel("")
Out[19]:
(Text(0.5, 51.34375, ''), Text(69.078125, 0.5, ''))技能要求
In [20]:
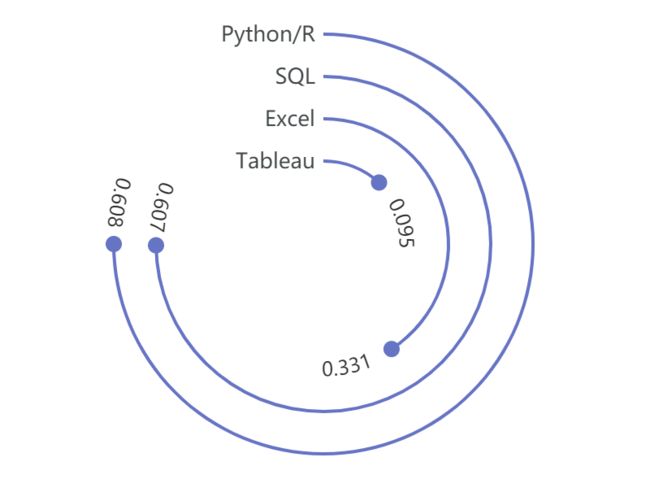
py_rate = df["Python/R"].value_counts(normalize=True).loc[1]
sql_rate = df["SQL"].value_counts(normalize=True).loc[1]
tableau_rate = df["Tableau"].value_counts(normalize=True).loc[1]
excel_rate = df["Excel"].value_counts(normalize=True).loc[1]
print("职位技能需求:")
print("Python/R:",py_rate)
print("SQL:",sql_rate)
print("Excel:",excel_rate)
print("Tableau:",tableau_rate)
职位技能需求:
Python/R: 0.6078431372549019
SQL: 0.6070889894419306
Excel: 0.3310708898944193
Tableau: 0.09502262443438914
In [21]:
def get_level(x):
    if x["Python/R"] == 1:
        x["skill"] = "Python/R"
    elif x["SQL"] == 1:
        x["skill"] = "SQL"
    elif x["Excel"] == 1:
        x["skill"] = "Excel"
    else:
        x["skill"] = "其他"
    return x
In [22]:
df = df.apply(get_level,axis=1)
In [24]:
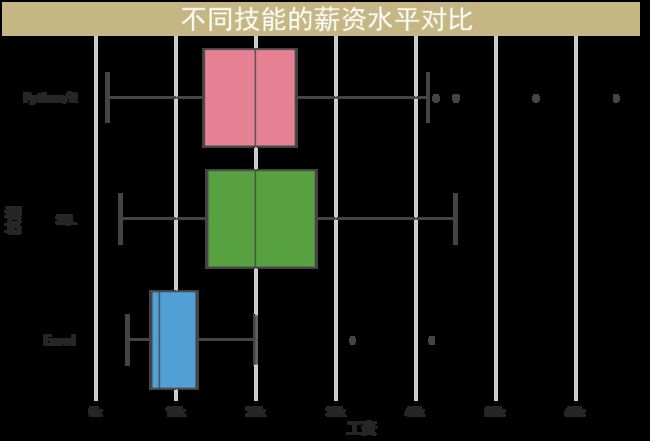
fig,ax = plt.subplots(figsize=(12,8))
fig.text(x=0.02, y=0.90, s='             不同技能的薪资水平对比            ',
         fontsize=32, weight='bold', color='white', backgroundcolor='#c5b783')
sns.boxplot(y="skill",x="salary",data=df.loc[df.skill!="其他"],palette="husl",order=["Python/R","SQL","Excel"])
plt.tick_params(axis="both",labelsize=16)
ax.xaxis.grid(which='both', linewidth=0.75)
plt.xticks(np.arange(0,61,10), [str(i)+"k" for i in range(0,61,10)])
plt.box(False)
plt.xlabel('工资', fontsize=18)
plt.ylabel('技能', fontsize=18)
Out[24]:
Text(0, 0.5, '技能')学历要求
In [23]:
education = df["education"].value_counts(normalize=True)
In [24]:
from pyecharts.commons.utils import JsCode
def new_label_opts():
        return opts.LabelOpts(formatter=JsCode("学历要求"))
pie = (
    Pie()
    .add(
        "",
        [list(z) for z in zip(education.index, np.round(education.values,4))],
        center=["50%", "50%"],
        radius=["50%","75%"],
        label_opts=new_label_opts()
    )
    .set_global_opts(
        title_opts=opts.TitleOpts(title=""),
        legend_opts=opts.LegendOpts(
                is_show=False
            )
    )
    .set_series_opts(label_opts=opts.LabelOpts(formatter="{b}: {d}%")))
E:\software\Anaconda3\lib\site-packages\pyecharts\charts\chart.py:14: PendingDeprecationWarning: pyecharts 各 Chart 将在 1.9.0 版本开始强制使用 ChartItem 进行数据项配置
  super().__init__(init_opts=init_opts)
In [26]:
pie.render_notebook()
Out[26]:
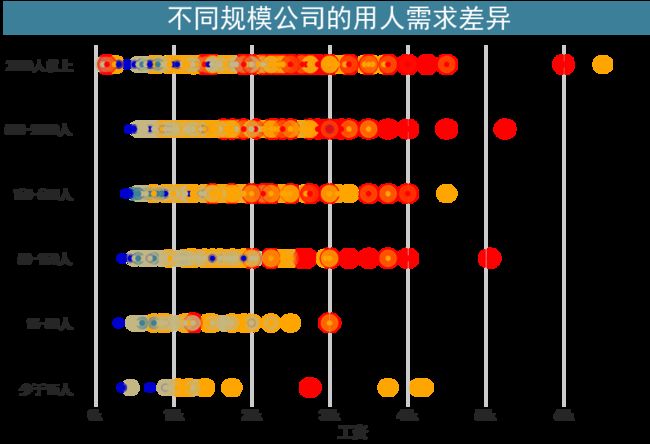
不同规模的公司在招人要求上的差异
In [46]:
company_size_map = {
    "2000人以上": 6,
    "500-2000人": 5,
    "150-500人": 4,
    "50-150人": 3,
    "15-50人": 2,
    "少于15人": 1
}
workYear_map = {
    "5-10年": 5,
    "3-5年": 4,
    "1-3年": 3,
    "1年以下": 2,
    "应届毕业生": 1
}
df["company_size"] = df["companySize"].map(company_size_map)
df["work_year"] = df["workYear"].map(workYear_map)
In [47]:
df = df.sort_values(by="company_size",ascending=True)
In [48]:
df_plot = df.loc[~df.work_year.isna()]
In [49]:
color_map = {
    5:"#ff0000",
    4:"#ffa500",
    3:"#c5b783",
    2:"#3c7f99",
    1:"#0000cd"
}
df_plot["color"] = df_plot.work_year.map(color_map)
df_plot.reset_index(drop=True,inplace=True)
E:\software\Anaconda3\lib\site-packages\ipykernel_launcher.py:8: SettingWithCopyWarning:
A value is trying to be set on a copy of a slice from a DataFrame.
Try using .loc[row_indexer,col_indexer] = value instead

See the caveats in the documentation: http://pandas.pydata.org/pandas-docs/stable/indexing.html#indexing-view-versus-copy
In [50]:
def seed_scale_plot():
    seeds=np.arange(5)+1
    y=np.zeros(len(seeds),dtype=int)
    s=seeds*100
    colors=['#ff0000', '#ffa500', '#c5b783', '#3c7f99', '#0000cd'][::-1]
    fig,ax=plt.subplots(figsize=(12,1))
    plt.scatter(seeds,y,s=s,c=colors,alpha=0.3)
    plt.scatter(seeds,y,c=colors)
    plt.box(False)
    plt.grid(False)
    plt.xticks(ticks=seeds,labels=list(workYear_map.keys())[::-1],fontsize=14)
    plt.yticks(np.arange(1),labels=['  经验:'],fontsize=16)
In [51]:
fig, ax = plt.subplots(figsize=(12, 8))
fig.text(x=0.03, y=0.92, s='            不同规模公司的用人需求差异          ', fontsize=32,
         weight='bold', color='white', backgroundcolor='#3c7f99')
plt.scatter(df_plot.salary, df_plot["companySize"],  s=df_plot["work_year"]*100 ,alpha=0.35,c=df_plot["color"])
plt.scatter(df_plot.salary, df_plot["companySize"], c=df_plot["color"].values.tolist())
plt.tick_params(axis='both', which='both', length=0)
plt.tick_params(axis='both', which='major', labelsize=16)
ax.xaxis.grid(which='both', linewidth=0.75)
plt.xticks(np.arange(0,61,10), [str(i)+"k" for i in range(0,61,10)])
plt.xlabel('工资', fontsize=18)
plt.box(False)
seed_scale_plot()
In [52]:
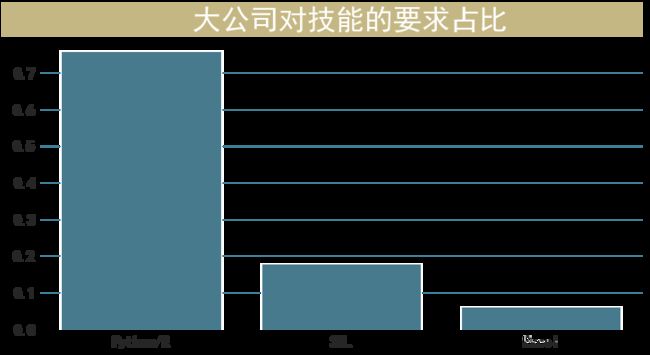
df_skill = df.loc[(df["companySize"]=="2000人以上")&(df.skill!="其他")]["skill"].value_counts(normalize=True)
In [53]:
df_skill
Out[53]:
Python/R    0.760234
SQL         0.178363
Excel       0.061404
Name: skill, dtype: float64
In [54]:
fig, ax = plt.subplots(figsize=(12, 6))
sns.barplot(x=df_skill.index,y=df_skill.values, color='#3c7f99')
plt.box(False)

fig.text(x=0.08, y=0.9, s='             大公司对技能的要求占比         ',
         fontsize=32, weight='bold', color='white', backgroundcolor='#c5b783')
plt.tick_params(axis='both', which='major', labelsize=16)
ax.yaxis.grid(which='both', linewidth=0.5, color='#3c7f99')
