web实战基础(pycharts篇):pycharts基础知识科普和案例解析
这是一篇非常非常基础的入门教程,但是也能让你深入了解pycharts的实现机制和带着你深入了解细节的设计,因此非常建议你能看完,相信一定会有所收获!
让我们一起加油,加加油!
文章目录
- 一、pycharts简介
- (一)特性
- (二)安装
- (三)查看版本
- 二、入门案例
- 三、定制主题
- 四、options 配置项
- 五、柱形图Bar
- (一)增加多一个数据列
- (二)实现堆叠效果
- (三)实现堆叠效果(部分)
- (四)回到标题栏
- (五)继续坐标轴
- (六)设置是否显示数值
- (七)区域选择
- (八)区域缩放
- 1、水平选择
- 2、垂直选择
- (九)工具栏设置
- (十)tip侧边条
- (十一)自定义颜色
- (十二)增加背景图
- (十三)设置markpoint
- (十四)设置markline
- (十五)保存成图片
一、pycharts简介
python 擅于数据处理,echarts 是百度开源的数据可视化项目,将二者结合起来,也就诞生了 pyecharts 。
(一)特性
简洁的 API 设计,使用如丝滑般流畅,支持链式调用
囊括了 30+ 种常见图表,应有尽有
支持主流 Notebook环境,Jupyter Notebook 和 JupyterLab
可轻松集成至 Flask,Django 等主流 Web 框架
高度灵活的配置项,可轻松搭配出精美的图表
(二)安装
pip install pyecharts
如果下载较慢,可以换用下面方法:
pip install pyecharts -i https://pypi.tuna.tsinghua.edu.cn/simple
(三)查看版本
import pyecharts
print(pyecharts.__version__)
建议使用pyecharts1.x的版本。
二、入门案例
from pyecharts.charts import Bar
from pyecharts import options as opts
# 内置主题类型可查看 pyecharts.globals.ThemeType
from pyecharts.globals import ThemeType

bar = (
    Bar(init_opts=opts.InitOpts(theme=ThemeType.LIGHT))
    .add_xaxis(["衬衫", "羊毛衫", "雪纺衫", "裤子", "高跟鞋", "袜子"])
    .add_yaxis("商家A", [5, 20, 36, 10, 75, 90])
    .set_global_opts(title_opts=opts.TitleOpts(title="主标题", subtitle="副标题"))
    # 或者直接使用字典参数
    # .set_global_opts(title_opts={"text": "主标题", "subtext": "副标题"})
)
bar.render('templates\index.html')

# # 不习惯链式调用的开发者依旧可以单独调用方法
# bar = Bar(init_opts=opts.InitOpts(theme=ThemeType.LIGHT))
# bar.add_xaxis(["衬衫", "羊毛衫", "雪纺衫", "裤子", "高跟鞋", "袜子"])
# bar.add_yaxis("商家A", [5, 20, 36, 10, 75, 90])
# bar.set_global_opts(title_opts=opts.TitleOpts(title="主标题", subtitle="副标题"))
# bar.render()
里面有三个点需要关注:
1、初始化图形,可以使用常规的对象赋值的方式,也可以采用链式调用的方式进行设置。
2、如果需要使用内置的主题类型可在初始化时进行设置。内置主题类型可查看 pyecharts.globals.ThemeType。
3、如果需要把生成的图形保存成图片,可以使用函数make_snapshot进行生成。
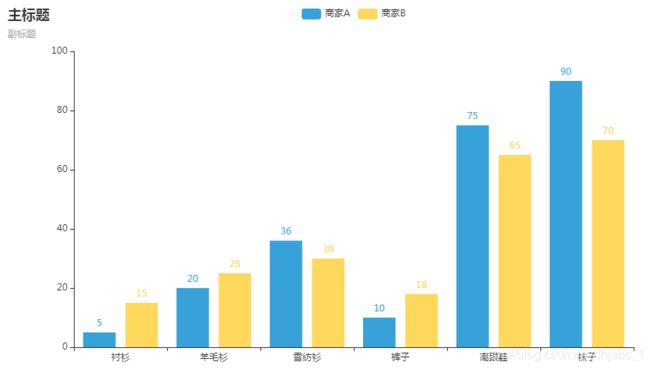
最终出来的效果如下:
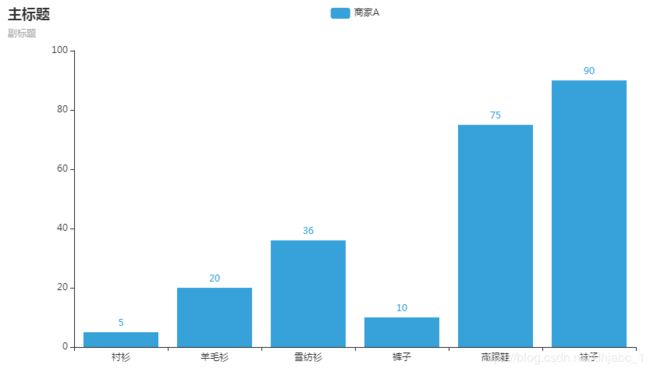
三、定制主题
pyechart给使用用户提供了一套主题样式,使用户对其的使用更加方便。
可以通过如下代码查看:
from pyecharts.globals import ThemeType
help(ThemeType)
如果要使用主题,可以使用如下代码进行设置:
from pyecharts.globals import ThemeType
init_opts=opts.InitOpts(theme=ThemeType.LIGHT)
包括如下10+种的主题样式:
 |  BUILTIN_THEMES = ['light', 'dark', 'white']
 |
 |  CHALK = 'chalk'
 |
 |  DARK = 'dark'
 |
 |  ESSOS = 'essos'
 |
 |  INFOGRAPHIC = 'infographic'
 |
 |  LIGHT = 'light'
 |
 |  MACARONS = 'macarons'
 |
 |  PURPLE_PASSION = 'purple-passion'
 |
 |  ROMA = 'roma'
 |
 |  ROMANTIC = 'romantic'
 |
 |  SHINE = 'shine'
 |
 |  VINTAGE = 'vintage'
 |
 |  WALDEN = 'walden'
 |
 |  WESTEROS = 'westeros'
 |
 |  WHITE = 'white'
 |
 |  WONDERLAND = 'wonderland'
四、options 配置项
在 pyecharts 中,一切皆 Options。
全局配置项可通过
set_global_options方法设置。
局部配置项可通过set_series_opts方法设置。
五、柱形图Bar
基于上述的配置项,对入门案例进行拓展。
(一)增加多一个数据列
from pyecharts.charts import Bar
from pyecharts import options as opts
from pyecharts.globals import ThemeType

bar = (
    Bar(init_opts=opts.InitOpts(theme=ThemeType.LIGHT))
    .add_xaxis(["衬衫", "羊毛衫", "雪纺衫", "裤子", "高跟鞋", "袜子"])
    .add_yaxis("商家A", [5, 20, 36, 10, 75, 90])
    .add_yaxis("商家B", [15, 25, 30, 18,65, 70])
    .set_global_opts(title_opts=opts.TitleOpts(title="主标题", subtitle="副标题"))
)
bar.render('templates\index.html')
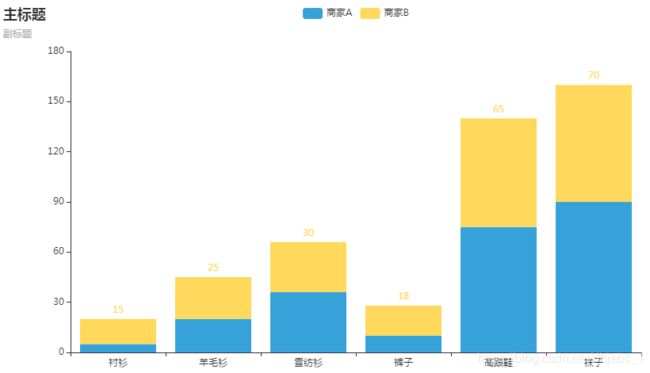
(二)实现堆叠效果
from pyecharts.charts import Bar
from pyecharts import options as opts
from pyecharts.globals import ThemeType

bar = (
    Bar(init_opts=opts.InitOpts(theme=ThemeType.LIGHT))
    .add_xaxis(["衬衫", "羊毛衫", "雪纺衫", "裤子", "高跟鞋", "袜子"])
    .add_yaxis("商家A", [5, 20, 36, 10, 75, 90], stack="stack1")
    .add_yaxis("商家B", [15, 25, 30, 18,65, 70], stack="stack1")
    .set_global_opts(title_opts=opts.TitleOpts(title="主标题", subtitle="副标题"))
)
bar.render('templates\index.html')
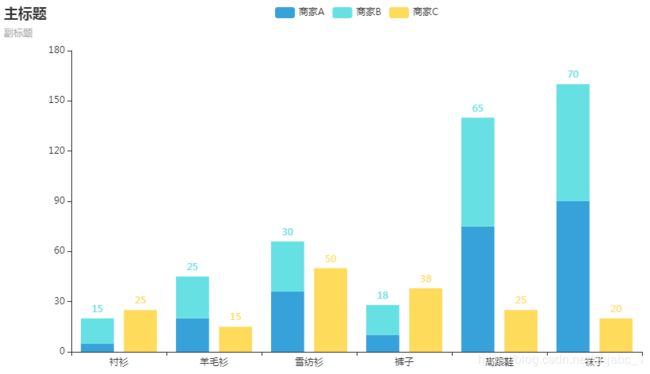
(三)实现堆叠效果(部分)
from pyecharts.charts import Bar
from pyecharts import options as opts
from pyecharts.globals import ThemeType

bar = (
    Bar(init_opts=opts.InitOpts(theme=ThemeType.LIGHT))
    .add_xaxis(["衬衫", "羊毛衫", "雪纺衫", "裤子", "高跟鞋", "袜子"])
    .add_yaxis("商家A", [5, 20, 36, 10, 75, 90], stack="stack1")
    .add_yaxis("商家B", [15, 25, 30, 18,65, 70], stack="stack1")
    .add_yaxis("商家C", [25, 15, 50, 38,25, 20])
    .set_global_opts(title_opts=opts.TitleOpts(title="主标题", subtitle="副标题"))
)
bar.render('templates\index.html')
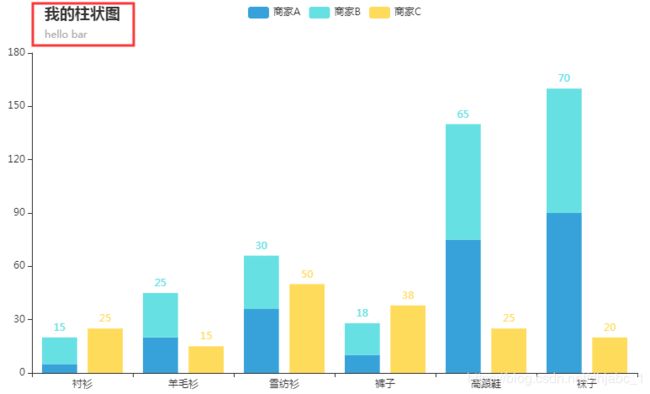
(四)回到标题栏
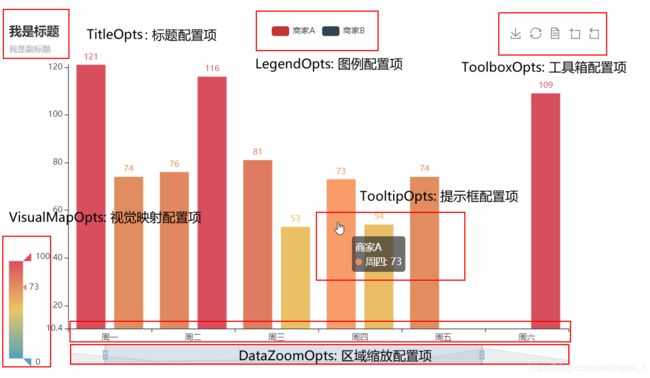
通过修改TitleOpts:标题配置项进行设置。
from pyecharts.charts import Bar
from pyecharts import options as opts
from pyecharts.globals import ThemeType

bar = (
    Bar(init_opts=opts.InitOpts(theme=ThemeType.LIGHT))
    .add_xaxis(["衬衫", "羊毛衫", "雪纺衫", "裤子", "高跟鞋", "袜子"])
    .add_yaxis("商家A", [5, 20, 36, 10, 75, 90], stack="stack1")
    .add_yaxis("商家B", [15, 25, 30, 18,65, 70], stack="stack1")
    .add_yaxis("商家C", [25, 15, 50, 38,25, 20])
    .set_global_opts(title_opts=opts.TitleOpts(title="我的柱状图", subtitle="hello bar",pos_left=100))
)
bar.render('templates\index.html')
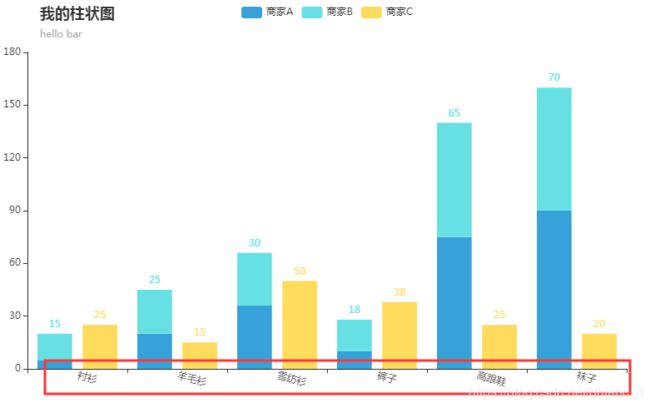
(五)继续坐标轴
通过修改AxisOpts:坐标轴配置项进行设置。
from pyecharts.charts import Bar
from pyecharts import options as opts
from pyecharts.globals import ThemeType

bar = (
    Bar(init_opts=opts.InitOpts(theme=ThemeType.LIGHT))
    .add_xaxis(["衬衫", "羊毛衫", "雪纺衫", "裤子", "高跟鞋", "袜子"])
    .add_yaxis("商家A", [5, 20, 36, 10, 75, 90], stack="stack1")
    .add_yaxis("商家B", [15, 25, 30, 18,65, 70], stack="stack1")
    .add_yaxis("商家C", [25, 15, 50, 38,25, 20])
    .set_global_opts(
        xaxis_opts=opts.AxisOpts(axislabel_opts=opts.LabelOpts(rotate=-15)),
        title_opts=opts.TitleOpts(title="我的柱状图", subtitle="hello bar",pos_left=100)
    )
)
bar.render('templates\index.html')
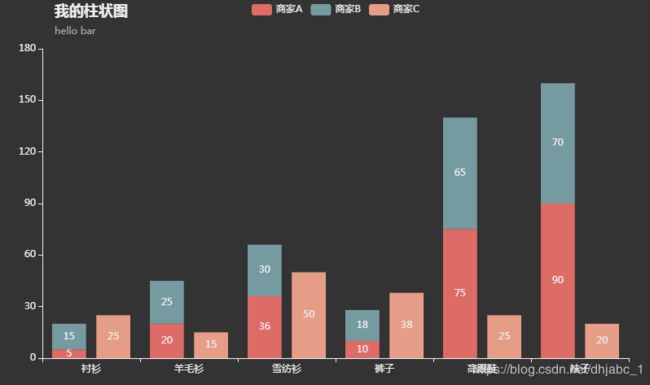
(六)设置是否显示数值
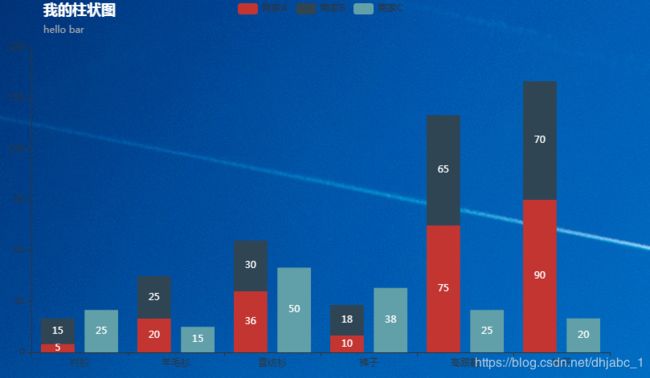
换一个主题风格theme=ThemeType.DARK,好看些!
from pyecharts.charts import Bar
from pyecharts import options as opts
from pyecharts.globals import ThemeType

bar = (
    Bar(init_opts=opts.InitOpts(theme=ThemeType.DARK))
    .add_xaxis(["衬衫", "羊毛衫", "雪纺衫", "裤子", "高跟鞋", "袜子"])
    .add_yaxis("商家A", [5, 20, 36, 10, 75, 90], stack="stack1")
    .add_yaxis("商家B", [15, 25, 30, 18,65, 70], stack="stack1")
    .add_yaxis("商家C", [25, 15, 50, 38,25, 20])
    .set_series_opts(label_opts=opts.LabelOpts(is_show=True,position="inside"))
    .set_global_opts(
        # xaxis_opts=opts.AxisOpts(axislabel_opts=opts.LabelOpts(rotate=-15)),
        title_opts=opts.TitleOpts(title="我的柱状图", subtitle="hello bar",pos_left=100)
    )
)
bar.render('templates\index.html')
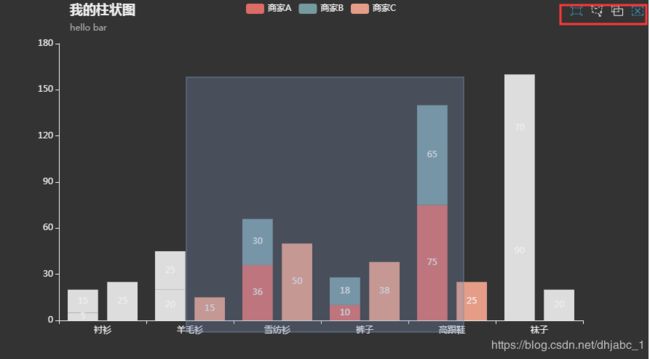
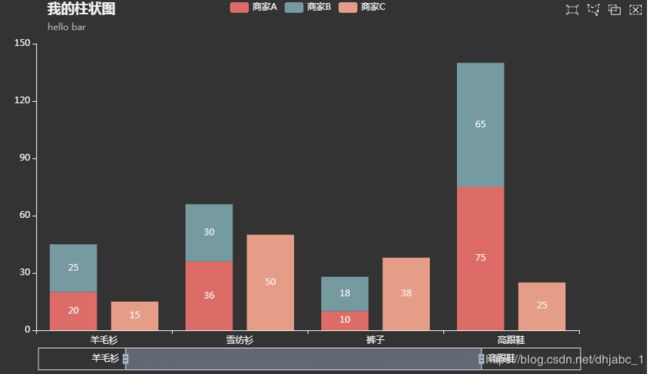
(七)区域选择
通过设置BrushOpts:区域选择组件配置项进行设置
from pyecharts.charts import Bar
from pyecharts import options as opts
from pyecharts.globals import ThemeType

bar = (
    Bar(init_opts=opts.InitOpts(theme=ThemeType.DARK))
    .add_xaxis(["衬衫", "羊毛衫", "雪纺衫", "裤子", "高跟鞋", "袜子"])
    .add_yaxis("商家A", [5, 20, 36, 10, 75, 90], stack="stack1")
    .add_yaxis("商家B", [15, 25, 30, 18,65, 70], stack="stack1")
    .add_yaxis("商家C", [25, 15, 50, 38,25, 20])
    .set_series_opts(label_opts=opts.LabelOpts(is_show=True,position="inside"))
    .set_global_opts(
        brush_opts=opts.BrushOpts(),
        title_opts=opts.TitleOpts(title="我的柱状图", subtitle="hello bar",pos_left=100)
    )
)
bar.render('templates\index.html')
(八)区域缩放
1、水平选择
通过DataZoomOpts:区域缩放配置项设置,可以直接在鼠标进行图形缩放。
from pyecharts.charts import Bar
from pyecharts import options as opts
from pyecharts.globals import ThemeType

bar = (
    Bar(init_opts=opts.InitOpts(theme=ThemeType.DARK))
    .add_xaxis(["衬衫", "羊毛衫", "雪纺衫", "裤子", "高跟鞋", "袜子"])
    .add_yaxis("商家A", [5, 20, 36, 10, 75, 90], stack="stack1")
    .add_yaxis("商家B", [15, 25, 30, 18,65, 70], stack="stack1")
    .add_yaxis("商家C", [25, 15, 50, 38,25, 20])
    .set_series_opts(label_opts=opts.LabelOpts(is_show=True,position="inside"))
    .set_global_opts(
        brush_opts=opts.BrushOpts(),
        datazoom_opts=opts.DataZoomOpts(),
        title_opts=opts.TitleOpts(title="我的柱状图", subtitle="hello bar",pos_left=100)
    )
)
bar.render('templates\index.html')
2、垂直选择
from pyecharts.charts import Bar
from pyecharts import options as opts
from pyecharts.globals import ThemeType

bar = (
    Bar(init_opts=opts.InitOpts(theme=ThemeType.DARK))
    .add_xaxis(["衬衫", "羊毛衫", "雪纺衫", "裤子", "高跟鞋", "袜子"])
    .add_yaxis("商家A", [5, 20, 36, 10, 75, 90], stack="stack1")
    .add_yaxis("商家B", [15, 25, 30, 18,65, 70], stack="stack1")
    .add_yaxis("商家C", [25, 15, 50, 38,25, 20])
    .set_series_opts(label_opts=opts.LabelOpts(is_show=True,position="inside"))
    .set_global_opts(
        brush_opts=opts.BrushOpts(),
        # datazoom_opts=opts.DataZoomOpts(),
        datazoom_opts=opts.DataZoomOpts(orient="vertical"),
        title_opts=opts.TitleOpts(title="我的柱状图", subtitle="hello bar",pos_left=100),
        yaxis_opts=opts.AxisOpts(name="我是 Y 轴"),
        xaxis_opts = opts.AxisOpts(name="我是 X 轴"),
)
)
bar.render('templates\index.html')
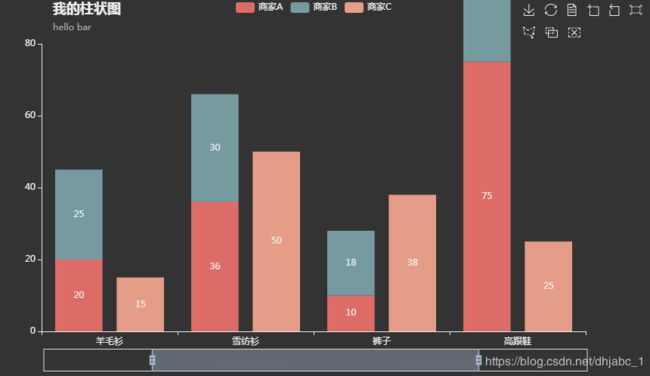
(九)工具栏设置
from pyecharts.charts import Bar
from pyecharts import options as opts
from pyecharts.globals import ThemeType

bar = (
    Bar(init_opts=opts.InitOpts(theme=ThemeType.DARK))
    .add_xaxis(["衬衫", "羊毛衫", "雪纺衫", "裤子", "高跟鞋", "袜子"])
    .add_yaxis("商家A", [5, 20, 36, 10, 75, 90], stack="stack1")
    .add_yaxis("商家B", [15, 25, 30, 18,65, 70], stack="stack1")
    .add_yaxis("商家C", [25, 15, 50, 38,25, 20])
    .set_series_opts(label_opts=opts.LabelOpts(is_show=True,position="inside"))
    .set_global_opts(
        brush_opts=opts.BrushOpts(),
        datazoom_opts=opts.DataZoomOpts(),
        toolbox_opts=opts.ToolboxOpts(),
        title_opts=opts.TitleOpts(title="我的柱状图", subtitle="hello bar",pos_left=100)
    )
)
bar.render('templates\index.html')
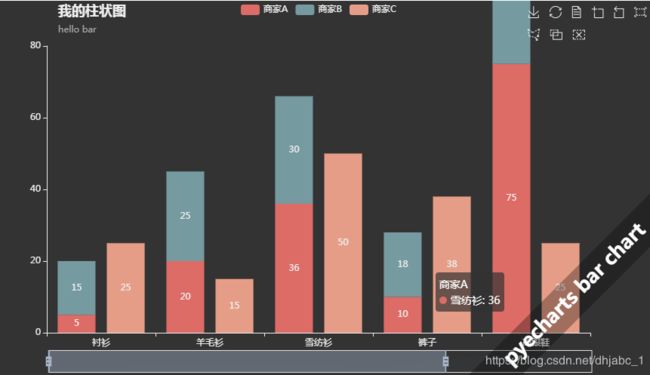
(十)tip侧边条
from pyecharts.charts import Bar
from pyecharts import options as opts
from pyecharts.globals import ThemeType
from pyecharts.commons.utils import JsCode

bar = (
    Bar(init_opts=opts.InitOpts(theme=ThemeType.DARK))
    .add_xaxis(["衬衫", "羊毛衫", "雪纺衫", "裤子", "高跟鞋", "袜子"])
    .add_yaxis("商家A", [5, 20, 36, 10, 75, 60], stack="stack1")
    .add_yaxis("商家B", [15, 25, 30, 18,65, 70], stack="stack1")
    .add_yaxis("商家C", [25, 15, 50, 38,25, 20])
    .set_series_opts(label_opts=opts.LabelOpts(is_show=True,position="inside"))
    .set_global_opts(
        brush_opts=opts.BrushOpts(),
        datazoom_opts=opts.DataZoomOpts(),
        toolbox_opts=opts.ToolboxOpts(),
        title_opts=opts.TitleOpts(title="我的柱状图", subtitle="hello bar",pos_left=100),
        graphic_opts=[
          opts.GraphicGroup(
              graphic_item=opts.GraphicItem(
                  rotation=JsCode("Math.PI / 4"),
                  bounding = "raw",
                  right = 110,
                  bottom = 110,
                  z = 100,
              ),
        children = [
               opts.GraphicRect(
                   graphic_item=opts.GraphicItem(
                       left="center", top="center", z=100
                   ),
                   graphic_shape_opts=opts.GraphicShapeOpts(width=400, height=50),
                   graphic_basicstyle_opts=opts.GraphicBasicStyleOpts(
                       fill="rgba(0,0,0,0.3)"
                   ),
               ),
               opts.GraphicText(
                   graphic_item=opts.GraphicItem(
                       left="center", top="center", z=100
                   ),
                   graphic_textstyle_opts=opts.GraphicTextStyleOpts(
                       text="pyecharts bar chart",
                       font="bold 26px Microsoft YaHei",
                       graphic_basicstyle_opts=opts.GraphicBasicStyleOpts(
                           fill="#fff"
                       ),
                   ),
               ),
           ],
    )
    ]
    )
)
bar.render('templates\index.html')
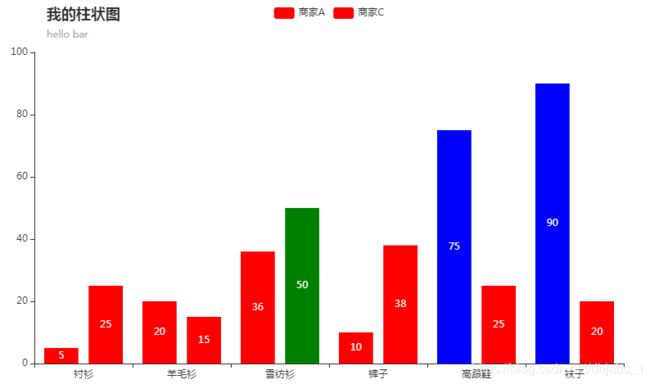
(十一)自定义颜色
from pyecharts.charts import Bar
from pyecharts import options as opts
from pyecharts.globals import ThemeType
from pyecharts.commons.utils import JsCode

color_function = """
        function (params) {
            if (params.value > 0 && params.value < 50) {
                return 'red';
            } else if (params.value > 50 && params.value < 100) {
                return 'blue';
            }
            return 'green';
        }
        """
bar = (
    Bar(init_opts=opts.InitOpts(theme=ThemeType.LIGHT))
    .add_xaxis(["衬衫", "羊毛衫", "雪纺衫", "裤子", "高跟鞋", "袜子"])
    .add_yaxis("商家A", [5, 20, 36, 10, 75, 90],
               itemstyle_opts=opts.ItemStyleOpts(color=JsCode(color_function)))
    .add_yaxis("商家C", [25, 15, 50, 38,25, 20],
               itemstyle_opts=opts.ItemStyleOpts(color=JsCode(color_function)))
    .set_series_opts(label_opts=opts.LabelOpts(is_show=True,position="inside"))
    .set_global_opts(
        title_opts=opts.TitleOpts(title="我的柱状图", subtitle="hello bar",pos_left=100),
)
)
bar.render('templates\index.html')
(十二)增加背景图
from pyecharts.charts import Bar
from pyecharts import options as opts
from pyecharts.globals import ThemeType
from pyecharts.commons.utils import JsCode

bar = (
    Bar(init_opts=opts.InitOpts(
        bg_color={"type": "pattern", "image": JsCode("img"), "repeat": "no-repeat"}
    ))
    .add_xaxis(["衬衫", "羊毛衫", "雪纺衫", "裤子", "高跟鞋", "袜子"])
    .add_yaxis("商家A", [5, 20, 36, 10, 75, 90], stack="stack1")
    .add_yaxis("商家B", [15, 25, 30, 18,65, 70], stack="stack1")
    .add_yaxis("商家C", [25, 15, 50, 38,25, 20])
    .set_series_opts(label_opts=opts.LabelOpts(is_show=True,position="inside"))
    .set_global_opts(
        title_opts=opts.TitleOpts(title="我的柱状图", subtitle="hello bar",pos_left=100,title_textstyle_opts=opts.TextStyleOpts(color="white"),),
)
)
bar.add_js_funcs(
    """
    var img = new Image(); img.src = 'static/1.jpg';
    """
)
bar.render('templates\index.html')
(十三)设置markpoint
通过修改MarkPointItem:标记点数据项进行设置。
from pyecharts.charts import Bar
from pyecharts import options as opts
from pyecharts.globals import ThemeType
from pyecharts.commons.utils import JsCode

bar = (
    Bar(init_opts=opts.InitOpts(theme=ThemeType.LIGHT))
    .add_xaxis(["衬衫", "羊毛衫", "雪纺衫", "裤子", "高跟鞋", "袜子"])
    .add_yaxis("商家A", [5, 20, 36, 10, 75, 90])
    .add_yaxis("商家B", [15, 25, 30, 18,65, 70])
    .set_series_opts(
        label_opts=opts.LabelOpts(is_show=False),
        markpoint_opts = opts.MarkPointOpts(
            data=[
                opts.MarkPointItem(type_="max", name="最大值"),
                opts.MarkPointItem(type_="min", name="最小值"),
                opts.MarkPointItem(type_="average", name="平均值"),
            ]
        ),
    )
    .set_global_opts(
        title_opts=opts.TitleOpts(title="我的柱状图", subtitle="hello bar",pos_left=100),
)
)
bar.render('templates\index.html')
(十四)设置markline
通过修改MarkLineItem:标记线数据项进行设置
from pyecharts.charts import Bar
from pyecharts import options as opts
from pyecharts.globals import ThemeType
from pyecharts.commons.utils import JsCode

bar = (
    Bar(init_opts=opts.InitOpts(theme=ThemeType.LIGHT))
    .add_xaxis(["衬衫", "羊毛衫", "雪纺衫", "裤子", "高跟鞋", "袜子"])
    .add_yaxis("商家A", [5, 20, 36, 10, 75, 90])
    .add_yaxis("商家B", [15, 25, 30, 18,65, 70])
    .set_series_opts(
        label_opts=opts.LabelOpts(is_show=True),
        markline_opts=opts.MarkLineOpts(
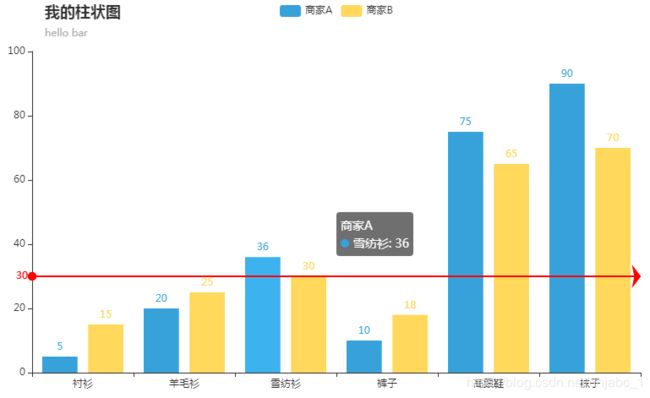
            data=[opts.MarkLineItem(y=30, name="yAxis=30")],
            symbol_size=[20,10],
            linestyle_opts=opts.LineStyleOpts(color='red',width=2)
        ),
    )
    .set_global_opts(
        title_opts=opts.TitleOpts(title="我的柱状图", subtitle="hello bar",pos_left=100),
)
)
bar.render('templates\index.html')
(十五)保存成图片
from pyecharts.charts import Bar
from pyecharts import options as opts
# 渲染图片
from pyecharts.render import make_snapshot
# 使用 snapshot-selenium 渲染图片
from snapshot_selenium import snapshot
# 内置主题类型可查看 pyecharts.globals.ThemeType
from pyecharts.globals import ThemeType

bar = (
    Bar(init_opts=opts.InitOpts(theme=ThemeType.LIGHT))
    .add_xaxis(["衬衫", "羊毛衫", "雪纺衫", "裤子", "高跟鞋", "袜子"])
    .add_yaxis("商家A", [5, 20, 36, 10, 75, 90])
    .set_global_opts(title_opts=opts.TitleOpts(title="主标题", subtitle="副标题"))
    # 或者直接使用字典参数
    # .set_global_opts(title_opts={"text": "主标题", "subtext": "副标题"})
)
make_snapshot(snapshot, bar.render(), "bar.png")
核心的代码如下:
#渲染图片
from pyecharts.render import make_snapshot
#使用 snapshot-selenium 渲染图片
from snapshot_selenium import snapshot
make_snapshot(snapshot, bar.render(), "bar.png")
OK,写了这么多,本来打算一篇写完的,但是发现里面的知识点太多,只写完了关于柱状图(Bar)的部分,后续我将会继续介绍常见的其他图形(如饼图、仪表盘等)的实现方式,敬请期待。
感谢你的关注!
参考:https://pyecharts.org/#/zh-cn/intro
