python爬虫爬取(中国空气质量在线监测分析平台)北京PM2.5,2013年至2018年的数据
要爬取的数据网站如下图所示:
即是爬取该网站2013年12月2日至2018年11月份北京空气质量指数历史数据,其中要爬起的 内容如PM2.5,So2等,即是从这个网页内置的表格中爬取,因为该网站比较有规律,代码实现不是很难,爬取上述表格数据,存储为csv文件格式,具体代码如下述所示:
import time
from urllib import parse
import pandas as pd
from selenium import webdriver
driver = webdriver.PhantomJS('phantomjs-2.1.1-windows\bin\phantomjs.exe')
base_url = 'https://www.aqistudy.cn/historydata/daydata.php?city='
def get_month_set():
    month_set = list()
    for i in range(12, 13):
        month_set.append(('2013-%s' % i))
    for i in range(1, 10):
        month_set.append(('2014-0%s' % i))
    for i in range(10, 13):
        month_set.append(('2014-%s' % i))
    for i in range(1, 10):
        month_set.append(('2015-0%s' % i))
    for i in range(10, 13):
        month_set.append(('2015-%s' % i))
    for i in range(1, 10):
        month_set.append(('2016-0%s' % i))
    for i in range(10, 13):
        month_set.append(('2016-%s' % i))
    for i in range(1, 10):
        month_set.append(('2017-0%s' % i))
    for i in range(10, 13):
        month_set.append(('2017-%s' % i))
    for i in range(1, 10):
        month_set.append(('2018-0%s' % i))
    for i in range(10, 11):
        month_set.append(('2018-%s' % i))
    return month_set
month_set = get_month_set()
city = '北京'
file_name = city + '.csv'
fp = open(file_name, 'w')
fp.write('%s,%s,%s,%s,%s,%s,%s,%s,%s\n'%('date','AQI','grade','PM25','PM10','SO2','CO','NO2','O3_8h'))#表头
for i in range(len(month_set)):
        str_month = month_set[i]
        weburl = ('%s%s&month=%s' % (base_url, parse.quote(city), str_month))
        driver.get(weburl)
        dfs = pd.read_html(driver.page_source,header=0)[0]
        time.sleep(1)#防止页面一带而过,爬不到内容
        for j in range(0,len(dfs)):
            date = dfs.iloc[j,0]
            aqi = dfs.iloc[j,1]
            grade = dfs.iloc[j,2]
            pm25 = dfs.iloc[j,3]
            pm10 = dfs.iloc[j,4]
            so2 = dfs.iloc[j,5]
            co = dfs.iloc[j,6]
            no2 = dfs.iloc[j,7]
            o3 = dfs.iloc[j,8]
            print(date)
            print(aqi)
            fp.write(('%s,%s,%s,%s,%s,%s,%s,%s,%s\n' % (date,aqi,grade,pm25,pm10,so2,co,no2,o3)))
            print('%d---%s,%s---DONE' % (city.index(city), city, str_month))
fp.close()
driver.quit()
print ('爬虫已经爬完!请检测!')
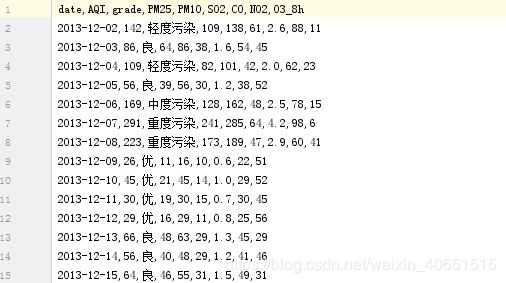
最后爬取结束以北京.csv进行存储。爬取的结果如下所示:
接下来利用该数据便能进行相关机器学习或者深度学习的算法实验了。

