【一周算法实践】--3.模型评估
模型评估
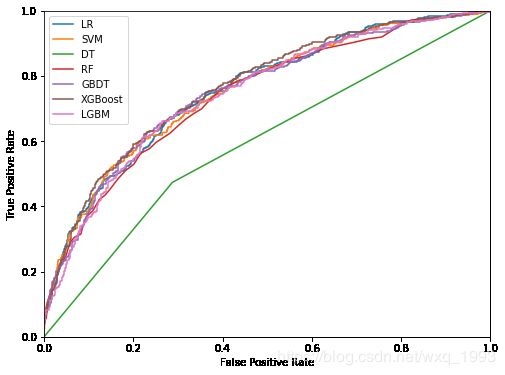
记录7个模型(逻辑回归、SVM、决策树、随机森林、GBDT、XGBoost和LightGBM)关于accuracy、precision,recall和F1-score、auc值的评分表格,并画出ROC曲线。
#1.导入要使用的模块
import numpy as np
import pandas as pd

from sklearn.model_selection import train_test_split
from sklearn.linear_model import LogisticRegression
from sklearn.svm import SVC
from sklearn.tree import DecisionTreeClassifier
from sklearn.ensemble import RandomForestClassifier,GradientBoostingClassifier
from lightgbm import LGBMClassifier
from xgboost import XGBClassifier
from sklearn.metrics import accuracy_score,f1_score,precision_score,recall_score,roc_auc_score,roc_curve
import matplotlib.pyplot as plt
from sklearn.preprocessing import StandardScaler
准确率Accuracy=正确分类的数量/总数量
精确率Precision=TP/(TP+FP)
所有预测为正例的测试样本中,正确预测的比例。
召回率Recall=TP/(TP+FN)
所有实际为正例的测试样本中,正确预测的比例。
F1值=2*(P*R)/(P+R)
P和R的加权平均值。
AUC就是从所有1样本中随机选取一个样本, 从所有0样本中随机选取一个样本,然后根据你的分类器对两个随机样本进行预测,把1样本预测为1的概率为p1,把0样本预测为1的概率为p0,p1>p0的概率就等于AUC。
#2.划分数据集并归一化
data_original=pd.read_csv('data_all.csv')
data_original.head(5)
data_original.describe()
data=data_original.copy()
y=data_original['status'].copy()
X=data_original.drop(['status'],axis=1).copy()
print("the X shape is:", X.shape)
print("the X shape is:" ,y.shape)
print("the nums of label 1 in y are",len(y[y==1]))
print("the nums of label 0 in y are",len(y[y==0]))

X_train,X_test,y_train,y_test=train_test_split(X,y,test_size=0.3,random_state=2018)
print('the proportition of label 1 in y_test: %.2f%%'%(len(y_test[y_test==1])/len(y_test)*100))
#数据标准化
ss=StandardScaler()
X_train=ss.fit_transform(X_train)
X_test=ss.fit_transform(X_test)
the X shape is: (4754, 84)
the X shape is: (4754,)
the nums of label 1 in y are 1193
the nums of label 0 in y are 3561
the proportition of label 1 in y_test: 25.16%
一共有4754组数据,每组数据中有84个特征;标签值中为1的有1193个,为0的有3561个;正样例与负样例数量差别较大,在后续处理应当考虑。
#3.建立模型与评估
df_result=pd.DataFrame(columns=('model','accuracy','precision','recall','f1_score','auc'))
row=0
#定义评价函数
def evaluate(y_pre,y):
    acc=accuracy_score(y,y_pre)
    p=precision_score(y,y_pre)
    r=recall_score(y,y_pre)
    f1=f1_score(y,y_pre)
    return acc,p,r,f1

lr_model=LogisticRegression()
svm_model=SVC(probability=True)
dt_model=DecisionTreeClassifier()
rf_model=RandomForestClassifier(n_estimators=100)
gbdt_model=GradientBoostingClassifier(n_estimators=100)
xgb_model=XGBClassifier(n_estimators=100)
lgbm_model=LGBMClassifier(n_estimators=100)

models={'LR':lr_model,
       'SVM':svm_model,
       'DT':dt_model,
       'RF':rf_model,
       'GBDT':gbdt_model,
       'XGBoost':xgb_model,
       'LGBM':lgbm_model}

for name,model in models.items():
    print(name,'start training...')
    model.fit(X_train,y_train)
    y_pred=model.predict(X_test)
    y_proba=model.predict_proba(X_test)
    acc,p,r,f1=evaluate(y_pred,y_test)
    auc=roc_auc_score(y_test,y_proba[:,1])
    df_result.loc[row]=[name,acc,p,r,f1,auc]
    row+=1
print(df_result)
LR start training...
SVM start training...
DT start training...
RF start training...
GBDT start training...
XGBoost start training...


D:\anaconda\lib\site-packages\sklearn\preprocessing\label.py:151: DeprecationWarning: The truth value of an empty array is ambiguous. Returning False, but in future this will result in an error. Use `array.size > 0` to check that an array is not empty.
  if diff:


LGBM start training...
     model  accuracy  precision    recall  f1_score       auc
0       LR  0.783462   0.630208  0.337047  0.439201  0.755832
1      SVM  0.782761   0.709402  0.231198  0.348739  0.754260
2       DT  0.652418   0.356394  0.473538  0.406699  0.593042
3       RF  0.775053   0.650794  0.228412  0.338144  0.740883
4     GBDT  0.771549   0.593220  0.292479  0.391791  0.752634
5  XGBoost  0.776454   0.621951  0.284123  0.390057  0.764929
6     LGBM  0.768746   0.592357  0.259053  0.360465  0.746740


D:\anaconda\lib\site-packages\sklearn\preprocessing\label.py:151: DeprecationWarning: The truth value of an empty array is ambiguous. Returning False, but in future this will result in an error. Use `array.size > 0` to check that an array is not empty.
  if diff:
SVC分类器中参数设置为:probability=True;并与任务2相同,都将RF、XGBboost、LGBM、GBDT的参数设置为;estimator=100
#4.绘制ROC曲线
def plot_roc_curve(fpr,tpr,label=None):
    plt.plot(fpr,tpr,label=label)

plt.figure(figsize=(8,6))
for name,model in models.items():
    proba=model.predict_proba(X_test)[:,1]
    fpr,tpr,thresholds=roc_curve(y_test,proba)
    plot_roc_curve(fpr,tpr,label=name)

plt.axis([0,1,0,1])
plt.xlabel('False Positive Rate')
plt.ylabel('True Positive Rate')
plt.legend()
plt.show()
结论:
1.通过数据标准化,提高了非集成模型的分类效果,在LR、SVM、DT模型中,LR模型表现最好,DT模型表现最差,可能存在树的深度过深,导致过拟合,一般采用剪枝操作。
2.在所有模型中XGBoost模型分类效果最好,通过数据标准化,集成模型的分类效果也有所提高。
参考:
1.https://shimo.im/docs/NTt9uqcuPhETs6w6
2.https://blog.csdn.net/bear507/article/details/85922463
