通过Tensorboard可视化分析神经网络实践
由于神经网络由大量的神经元组成,我们使用TensorFlow编写程序,设计神经网络,其实我们往往也不知道神经网络里头具体细节到底做了什么,要人工调试十分困难,我们经常使用绘图工具(matplotlib),绘制训练过程中的Loss、Acc图。训练神经网络可视化是深度学习神经网络开发、调试、应用中极为重要的手段。有了TensorBoard,可以将TensorFlow程序的执行步骤都显示出来,非常直观。
1. 关于TensorBoard
TensorBoard是tensorflow官方推出的可视化工具,通过对Tensoflow程序运行过程中输出的日志文件进行可视化Tensorflow程序的运行状态,它可以将模型训练过程中的参数、调优等各种数据展示出来,包括标量(Scalars)、图片(Images)、音频(Audio)、计算图(Graphs)、数据分布(Distributions)、直方图(Histograms)和潜入向量(Embeddigngs)。
通过Tensorflow开发等深度学习神经网络,代码执行过程是先构建图,再依图喂数据执行训练模型,这样对中间过程的调试不太方便;而且,在训练大型深度学习神经网络时,中间的计算过程大多非常复杂,因此为了理解、调试和优化神经网络,Tensorflow配套提供TensorBoard观察训练过程中的可视。
使用TensorBoard展示数据,需要在执行Tensorflow计算图的过程中,将各种类型的数据(summary protobuf)汇总并记录到日志文件中。然后使用TensorBoard读取这些日志文件,解析数据并生产数据可视化的Web页面,让我们可以在浏览器中观察各种汇总数据。
2. TensorBoard可视化内容
tf.summary.scalar(‘Loss’, loss) #记录标量
tf.summary.histogram(‘var_name’, var) #变量的直方图
tf.summary.distribution #变量的分布图
tf.summary.image #记录图像
2.1. 标量
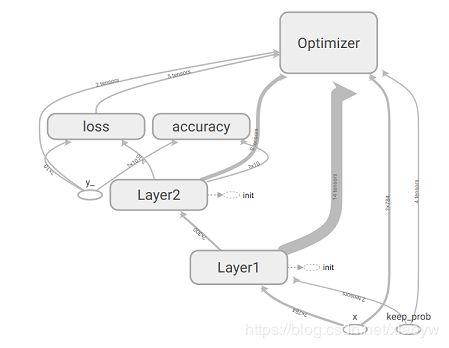
2.2. 计算图
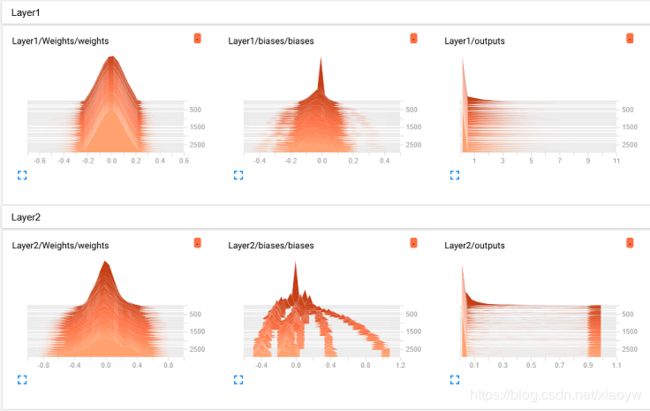
2.3. 变量的分布图
2.4. 变量的直方图
对于多维张量(Tensor)的输出,标量(scalar)在TensorFlow的神经网络中只占很少一部分,大部分变量是多维张量,即Tensor。由于一个Tensor有多个维度,无法像标量一样直接输出成曲线,在可视化时可以有以下几种方法:
- 将Tensor转化为标量输出
- 输出Tensor的分布直方图
3. TensorBoard的使用流程
- 定义并命名张量、标量
- 定义命名空间,以及多重命名空间
- 添加记录节点:tf.summary.scalar/image/histogram()等
- 汇总记录节点:merged = tf.summary.merge_all()
- 运行汇总节点:summary = sess.run(merged),得到汇总结果
- 日志书写器实例化:summary_writer = tf.summary.FileWriter(logdir, graph=sess.graph),实例化的同时传入 graph 将当前计算图写入日志
- 调用日志书写器实例对象summary_writer的add_summary(summary, global_step=i)方法将所有汇总日志写入文件
- 调用日志书写器实例对象summary_writer的close()方法写入内存,否则它每隔120s写入一次
- 命令行执行Tensorboard命令
- 浏览器查看
4. Tensorflow多层神经网络示例程序
首先,先给出未可视化处理的神经网络程序,后面将基于此代码加上可视化内容。
from tensorflow.examples.tutorials.mnist import input_data
import tensorflow as tf


#获取所有的数据集
mnist_data = input_data.read_data_sets("/MNIST_data",one_hot=True)

#定义神经网络的参数
in_units = 784
h1_units = 300
#定义输入变量
x = tf.placeholder(dtype=tf.float32,shape=[None,in_units],name='x')
#定义输出变量
y_ = tf.placeholder(dtype=tf.float32,shape=[None,10],name='y_')
w1 = tf.Variable(tf.truncated_normal([in_units,h1_units],stddev=0.1),name='weights1')
b1 = tf.Variable(tf.zeros([h1_units],dtype=tf.float32),name='biases1')
#手写数字0到9,10个
w2 = tf.Variable(tf.truncated_normal([h1_units,10],stddev=0.1),dtype=tf.float32,name='weights2')
b2 = tf.Variable(tf.zeros([10],dtype=tf.float32),name='biases2')
#定义dropout保留的节点数量
keep_prob = tf.placeholder(dtype=tf.float32,name='keep_prob')
#定义前向传播过程
h1 = tf.nn.relu(tf.add(tf.matmul(x,w1),b1))
#使用dropout
h1_drop = tf.nn.dropout(h1,keep_prob)
#定义输出y
y_conv = tf.nn.softmax(tf.matmul(h1_drop,w2)+b2,name='y')

#定义损失函数
loss_func = tf.reduce_mean(-tf.reduce_sum(y_*tf.log(y_conv),reduction_indices=[1]))
train_step = tf.train.AdagradOptimizer(0.3).minimize(loss_func)

correct_pred = tf.equal(tf.argmax(y_conv,1), tf.argmax(y_,1))
accuracy = tf.reduce_mean(tf.cast(correct_pred, tf.float32))

with tf.Session() as sess:
    sess.run(tf.global_variables_initializer())

    for i in range(3000):
        batch_xs,batch_ys = mnist_data.train.next_batch(100)
        sess.run(train_step, feed_dict={x:batch_xs,y_:batch_ys,keep_prob:0.75})

        if i%50 == 0:
            train_accuracy = accuracy.eval(feed_dict={x:batch_xs, y_: batch_ys, keep_prob: 1.0})
            print ("step {}, training accuracy {}".format(i, train_accuracy))

    #计算准确率
    print("train accuracy:",accuracy.eval({x:mnist_data.train.images,y_:mnist_data.train.labels,keep_prob:1.0}))
    print("test accuracy:",accuracy.eval({x:mnist_data.test.images,y_:mnist_data.test.labels,keep_prob:1.0}))
5. Tensorflow神经网络命名空间与写日志
Tensorboard可视化Tensorflow计算图,首先是将计算图中的节点和边直接可视化,其次是根据每个计算节点的命名空间来整理可视化得到效果图,使得神经网络的整体框架结构不会被过多的细节所淹没。可视化不仅显示Tensorflow计算图的结构,还可以展示计算节点上的信息进行描述统计,包括频数统计和分布统计。
为了有层次、抓住主体结构的可视化效果,Tensorboard通过命名空间来整理可视化效果图上的节点。在Tensorboard的默认视图中,计算图中同一个命名空间下的所有节点会被缩略为一个节点,而顶层命名空间的节点才会被显示在Tensorboard可视化效果图中。
5.1. 命名空间
命名空间采用树状结构,逐级细化节点和参数。我们以上面准备出来的简单神经网络为例,神经网络第一层命名为如下形式。
Tensorflow命名空间函数是tf.name_scope(),其作用为:
(1)在某个tf.name_scope()指定的区域中定义的所有对象及各种操作,他们的“name”属性上会增加该命名区的区域名,用以区别对象属于哪个区域;
(2)将不同的对象及操作放在由tf.name_scope()指定的区域中,便于在tensorboard中展示清晰的逻辑关系图,这点在复杂关系图中特别重要;
(3)只决定“对象”属于哪个范围和逻辑层次,并不会对“对象”的“作用域”产生任何影响;
(4)对于多重命名空间,也就是树状结构,需要多个with tf.name_scope()重叠使用。
with tf.name_scope("Layer1"):
    with tf.name_scope('Weights'):
        w1 = tf.Variable(tf.truncated_normal([in_units,h1_units],stddev=0.1),name='weights1')
        tf.summary.histogram('weights',w1)
    with tf.name_scope('biases'):
        b1 = tf.Variable(tf.zeros([h1_units],dtype=tf.float32),name='biases1')
        tf.summary.histogram('biases',b1)
    #定义前向传播过程
    h1 = tf.nn.relu(tf.add(tf.matmul(x,w1),b1))
    #使用dropout
    h1_drop = tf.nn.dropout(h1,keep_prob)
    tf.summary.histogram('outputs', h1_drop)
5.2. 直方图
在训练神经网络时,我们可通过tf.summary.histogram()查看一个张量在训练过程中值的分布情况,其分布情况是以直方图的形式在TensorBoard直方图仪表板上显示。
例如:
        b1 = tf.Variable(tf.zeros([h1_units],dtype=tf.float32),name='biases1')
        tf.summary.histogram('biases',b1)
展现图像时,distributions显示内容解析是distributions图和histogram图显示的数据源是相同的,只是用不同的方式对相同的内容进行展示。
5.3. 可视化数据采集
在tensorflow变量初始化之前,使用tf.summary.merge_all()函数合并所定义采集点变量汇总,并且使用tf.summary.FileWriter函数将它们写到之前定义的采集日志路径。
在训练神经网络过程中,把参数记录到指定文件中,例如本文中的文件夹“mlp_logs”。
summ = tf.summary.merge_all()

with tf.Session() as sess:
    sess.run(tf.global_variables_initializer())

    writer = tf.summary.FileWriter("mlp_logs/", graph=tf.get_default_graph())
日志书写器FileWriter中“mlp_logs”是日志文件所在的目录,这里是工程目录下的目录,第二个参数是事件文件要记录的图,也就是TensorFlow默认的图。
通过训练过程中sess.run()函数,同时运行汇总节点(本案例中的summ)。
    ......
    writer = tf.summary.FileWriter("mlp_logs/", graph=tf.get_default_graph())

    for i in range(3000):
        batch_xs,batch_ys = mnist_data.train.next_batch(100)
        _,loss_,summary = sess.run([train_step, loss_func, summ],feed_dict={x:batch_xs,y_:batch_ys,keep_prob:0.75})

        if i%50 == 0:
            train_accuracy = accuracy.eval(feed_dict={x:batch_xs, y_: batch_ys, keep_prob: 1.0})
            writer.add_summary(summary, i)     #将日志写入文件
            print ("step {}, training accuracy {}".format(i, train_accuracy))
总结上述过程如下:
- 可以调用其 add_summary() 方法将训练过程数据保存在 filewriter 指定的文件中。
- 添加记录节点:tf.summary.scalar/image/histogram()等
- 汇总记录节点:merged = tf.summary.merge_all()
- 运行汇总节点:summary = sess.run(merged),得到汇总结果
- 日志书写器实例化:summary_writer = tf.summary.FileWriter(logdir, graph=sess.graph),实例化的同时传入 graph 将当前计算图写入日志
- 调用日志书写器实例对象summary_writer的add_summary(summary, global_step=i)方法将所有汇总日志写入文件
- 调用日志书写器实例对象summary_writer的close()方法写入内存,否则它每隔120s写入一次
最后,完整的多层神经网络示例代码如下:
from tensorflow.examples.tutorials.mnist import input_data
import tensorflow as tf

#获取所有的数据集
mnist_data = input_data.read_data_sets("/MNIST_data",one_hot=True)

#定义神经网络的参数
in_units = 784
h1_units = 300
#定义输入变量
x = tf.placeholder(dtype=tf.float32,shape=[None,in_units],name='x')
#定义输出变量
y_ = tf.placeholder(dtype=tf.float32,shape=[None,10],name='y_')
#定义dropout保留的节点数量
keep_prob = tf.placeholder(dtype=tf.float32,name='keep_prob')

with tf.name_scope("Layer1"):
    with tf.name_scope('Weights'):
        w1 = tf.Variable(tf.truncated_normal([in_units,h1_units],stddev=0.1),name='weights1')
        tf.summary.histogram('weights',w1)
    with tf.name_scope('biases'):
        b1 = tf.Variable(tf.zeros([h1_units],dtype=tf.float32),name='biases1')
        tf.summary.histogram('biases',b1)
    #定义前向传播过程
    h1 = tf.nn.relu(tf.add(tf.matmul(x,w1),b1))
    #使用dropout
    h1_drop = tf.nn.dropout(h1,keep_prob)
    tf.summary.histogram('outputs', h1_drop)

#手写数字0到9,10个
with tf.name_scope("Layer2"):
    with tf.name_scope('Weights'):
        w2 = tf.Variable(tf.truncated_normal([h1_units,10],stddev=0.1),dtype=tf.float32,name='weights2')
        tf.summary.histogram('weights',w2)
    with tf.name_scope('biases'):
        b2 = tf.Variable(tf.zeros([10],dtype=tf.float32),name='biases2')
        tf.summary.histogram('biases',b2)
    #定义输出y
    y_conv = tf.nn.softmax(tf.matmul(h1_drop,w2)+b2,name='y')
    tf.summary.histogram('outputs', y_conv)

#定义损失函数
with tf.name_scope("loss"):
    loss_func = tf.reduce_mean(-tf.reduce_sum(y_*tf.log(y_conv),reduction_indices=[1]))
    tf.summary.scalar("loss",loss_func)
with tf.name_scope('Optimizer'):
    train_step = tf.train.AdagradOptimizer(0.3).minimize(loss_func)

with tf.name_scope('accuracy'):
    correct_pred = tf.equal(tf.argmax(y_conv,1), tf.argmax(y_,1))
    accuracy = tf.reduce_mean(tf.cast(correct_pred, tf.float32))
    tf.summary.scalar('accuracy', accuracy)
    tf.summary.histogram('accuracy', accuracy)

summ = tf.summary.merge_all()

with tf.Session() as sess:
    sess.run(tf.global_variables_initializer())

    writer = tf.summary.FileWriter("mlp_logs/", graph=tf.get_default_graph())

    for i in range(3000):
        batch_xs,batch_ys = mnist_data.train.next_batch(100)
        _,loss_,summary = sess.run([train_step, loss_func, summ],feed_dict={x:batch_xs,y_:batch_ys,keep_prob:0.75})
        #writer.add_summary(summary, i)     #将日志写入文件

        if i%50 == 0:
            train_accuracy = accuracy.eval(feed_dict={x:batch_xs, y_: batch_ys, keep_prob: 1.0})
            writer.add_summary(summary, i)     #将日志写入文件
            print ("step {}, training accuracy {}".format(i, train_accuracy))

    #计算准确率
    print("train accuracy:",accuracy.eval({x:mnist_data.train.images,y_:mnist_data.train.labels,keep_prob:1.0}))
    print("test accuracy:",accuracy.eval({x:mnist_data.test.images,y_:mnist_data.test.labels,keep_prob:1.0}))
6. TensorBoard可视化工具使用
接下来,我们使用TensorBoard进行可视化分析,在命令行窗口输入 tensorboard –logdir=mlp_log。在浏览器中打开“http://DESKTOP-KLSHRU3:6006”
D:\06Study\PyDev\Study\src>tensorboard --logdir mlp_logs
TensorBoard 1.10.0 at http://DESKTOP-KLSHRU3:6006 (Press CTRL+C to quit)
如果想终止TensorBoard的服务,可在开启这个服务的终端窗口,同时按下组合键“CTRL+C”,来终止它。
参考:
《tensorflow学习5:使用tensorboard可视化loss,weight,biases》 CSDN博客 xiexu911 2019.03
《使用Python开发工具Jupyter Notebook学习Tensorflow入门及Tensorboard实践》 CSDN博客 肖永威 2019.01


