摩拜单车数据初探
项目背景
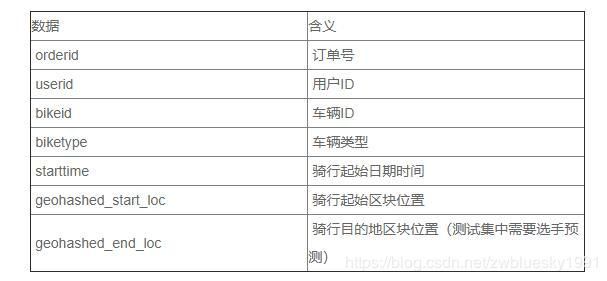
此项目是2017年biendata上的一个比赛项目,赛事方提供了300万行的训练数据和200万行的测试数据,旨在预测用户骑行目的地的区块位置。
本文将使用项目中给出的训练集数据train.csv进行数据的探索性分析,利用python工具来探索用户骑行规律,暂不涉及建模。
数据概况
#常规操作,首先导入各种需要的包
import pandas as pd
import numpy as np
import seaborn as sns
import matplotlib.pyplot as plt
from math import radians,cos,sin,asin,sqrt
%matplotlib inline
#读取训练集和测试集
train = pd.read_csv('./MOBIKE_CUP_2017/train.csv', sep = ',', parse_dates = ['starttime'])
test = pd.read_csv('./MOBIKE_CUP_2017/test.csv', sep = ',', parse_dates = ['starttime'])
#看看数据长什么样子
train.head()

emmmm,geohash是啥?查一下。
Geohash精度和原理,感兴趣的可以查看一下,这里不探究,只应用。
首先安装
!pip install geohash
然后导入
import geohash
然后继续查看数据情况
#测试集的情况
test.head()


训练集有320万条数据,测试集有200万条数据,训练集比测试集多了一列geohashed_end_loc,即是测试集需要预测的目的地,不过本次不做预测分析。

训练数据涉及近35万用户,48万辆车,2种车型。
数据处理
由于自己电脑配置原因(哭?,大哭??,使劲哭???),数据量较大运行较慢,所以将原测试集数据随机挑选50%进行分析。
train = train.sample(frac=0.5)
进行数据处理
def _processData(df):
    #将starttime 分成weekday,day,hour三类,方便后续不同时间段数据展示
    df['weekday'] = df['starttime'].apply(lambda s : s.weekday())
    df['day'] = df['starttime'].apply(lambda s : str(s)[:10])
    df['hour'] = df['starttime'].apply(lambda s : s.hour)
    print('时间处理完成!!!')

    #将geohash字符串反编码,方便后续计算骑行距离
    df['start_lat_lng'] = df['geohashed_start_loc'].apply(lambda s : geohash.decode(s))
    df['end_lat_lng'] = df['geohashed_end_loc'].apply(lambda s : geohash.decode(s))
    df['start_neighbors'] = df["geohashed_start_loc"].apply(lambda s : geohash.neighbors(s))

    #原数据中的geohash字符串是g7,现在转成g6
    df['geohashed_start_loc_6'] = df['geohashed_start_loc'].apply(lambda s : s[:6])
    df['geohashed_end_loc_6'] = df['geohashed_end_loc'].apply(lambda s : s[:6])
    df['start_neighbors_6'] = df["geohashed_start_loc_6"].apply(lambda s : geohash.neighbors(s))
    print('Geohash处理完成!!!')

    #判断目的地是否在neighbors
    def inGeohash(start_geohash, end_geohash, names):
        names.append(start_geohash)
        if end_geohash in names:
            return 1
        else:
            return 0
    df['inside'] = df.apply(lambda s : inGeohash(s['geohashed_start_loc'],s['geohashed_end_loc'],s['start_neighbors']), axis = 1)
    df['inside_6'] = df.apply(lambda s : inGeohash(s['geohashed_start_loc_6'],s['geohashed_end_loc_6'],s['start_neighbors_6']), axis = 1)
    print("Geohash近邻判断处理完成!!!")

    #计算起点与终点距离
    def haversine(lon1, lat1, lon2, lat2):
        """
        Calculate the great circle distance between two points
        on the earth (specified in decimal degrees)
        """
        lon1, lat1, lon2, lat2 = map(radians, [lon1, lat1, lon2, lat2])
        # haversine公式
        dlon = lon2 - lon1
        dlat = lat2 - lat1
        a = sin(dlat/2)**2 + cos(lat1) * cos(lat2) * sin(dlon/2)**2
        c = 2 * asin(sqrt(a))
        r = 6371 # 地球平均半径,单位为公里
        return c * r * 1000
    df['start_end_distance'] = df.apply(lambda s : haversine(s['start_lat_lng'][0],s['start_lat_lng'][1],s['end_lat_lng'][0],
                                                             s['end_lat_lng'][1]),axis = 1)
    print("距离计算完成!!!")
    return df
基本思路:
1.将起始日期分成星期,天,小时,方便后续进行不同时间的分析;
2.将geohash编码进行反编码,进行骑行距离的计算,并用neighbors方法算出以起点为中心的九宫格编码;
3.考虑到geohash7位编码距离较小,仅为153m × 153m的范围,实际骑行中基本都能超出范围,所以将7位编码转化成6位编码,范围增加到 1.22km × 0.61km,较为符合实际情况;
4.利用geohash判断训练集中的目的地是否在九宫格内;
5.计算骑行距离,公式直接从网上找的

上个厕所,倒杯水,等待数据处理完成。emmmmm,好像有什么不对的地方。
数据分析
时间段上的分析
def _timeAnalysis(df):
    #数据包含的天数
    print('数据集包含的天数如下:')
    print(df['day'].unique())
    print('*'*60)

    #用户出行小时高峰期
    g1 = df.groupby('hour')
    print(g1['orderid'].count().sort_values(ascending = False))
    print('*'*60)

    #周一到周日用车分析
    g1 = df.groupby('weekday')
    print(pd.DataFrame(g1['weekday'].count()))
    print('*'*60)

    #周一到周日不同时间的用车分析
    df.loc[(df['weekday'] == 5) | (df['weekday'] == 6), 'isWeekend'] = 1
    df.loc[~(df['weekday'] == 5) | (df['weekday'] == 6), 'isWeekend'] = 0
    g1 = df.groupby(['isWeekend', 'hour'])

    #计算工作日以及周末的天数
    g2 = df.groupby(['day', 'weekday'])
    w = 0 #周末天数
    c = 0 #工作日天数
    for i,j in list(g2.groups.keys()):
        if j >= 5:
            w += 1
        else:
            c += 1

    temp_df = pd.DataFrame(g1['orderid'].count()).reset_index()
    temp_df.loc[temp_df['isWeekend'] == 0 , 'orderid'] = temp_df['orderid']/c
    temp_df.loc[temp_df['isWeekend'] == 1 , 'orderid'] = temp_df['orderid']/w
    print(temp_df.sort_values(['isWeekend', 'orderid'], ascending = False))
    sns.barplot(x = 'hour', y = 'orderid', hue = 'isWeekend', data = temp_df)

训练集中的日期总共有14天

早上7点/8点及下午6点/7点骑行订单最多,符合早晚高峰出行的实际情况。

周一到周日订单基本都在20万左右,周三周四最多。

周末订单很少,订单最多的是工作日早晚高峰时期。从下图也可以看出。


从骑行距离的统计来看,大部分人都骑行不超过1公里,较为符合短途骑行的特点。最远的有40公里,属于异常值。
将超过5公里的去掉,查看分布情况。
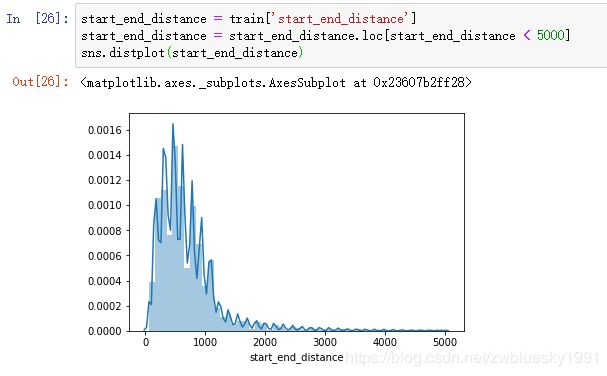
绝大多数骑行距离不超过1公里。


在不同时间上的平均骑行距离基本是一致的,没有特别突出的情况。
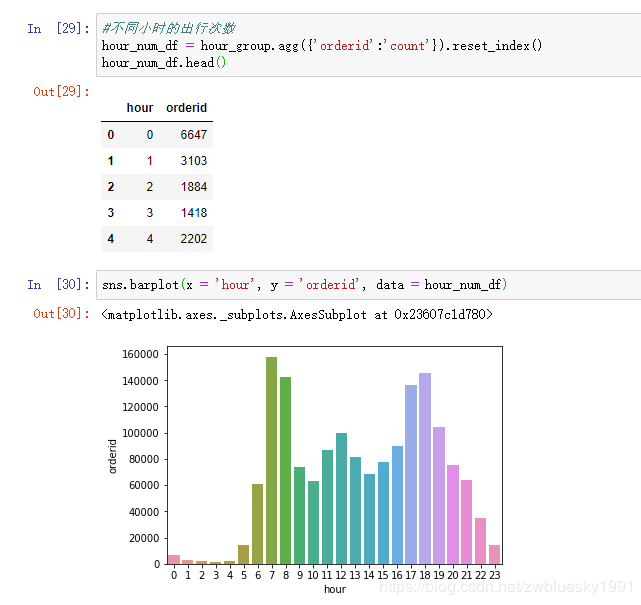
结果依然是早晚高峰出行次数最多。
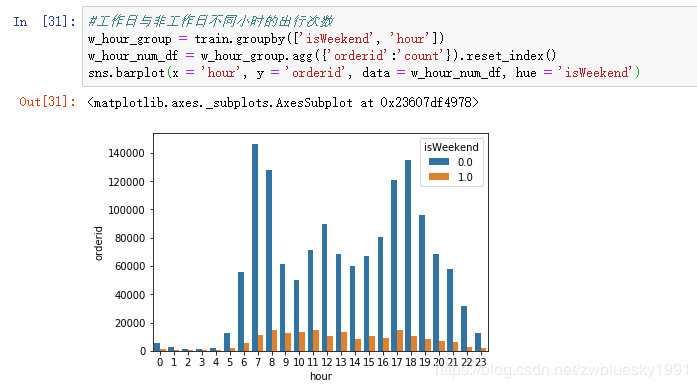
通过对比可以看出双休日没有早晚高峰出行特点。
小结:出行时间与是否工作日这两个特征对用户行为有着重要的影响。
下面分析一下起点和终点。
首先看一下每天从起点出发或到达的订单、用户、车辆。

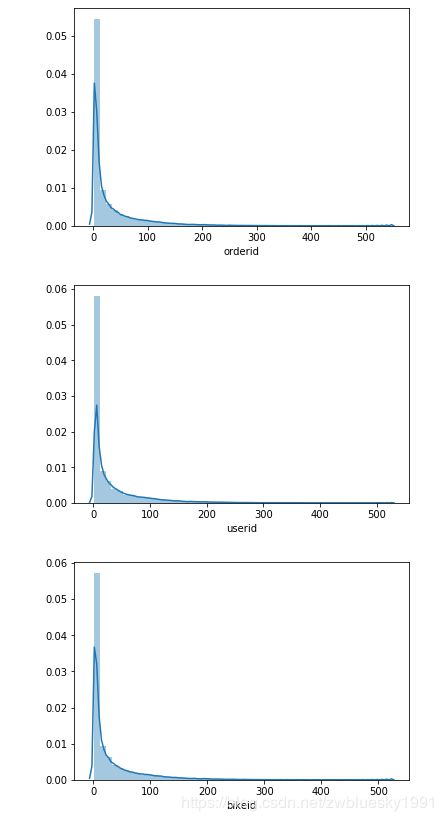
基本每个范围的数量大部分在100以下。
再看一下固定起点终点的订单、用户和车辆。
start_end = train.groupby(["day","geohashed_start_loc","geohashed_end_loc"])
# 计算 出发点-停车点 的 订单量,车辆数,用户数
start_end.agg({"orderid":"count","userid":"nunique","bikeid":"nunique","start_end_distance":"mean"}).reset_index().sort_values(by = "orderid",ascending = False)
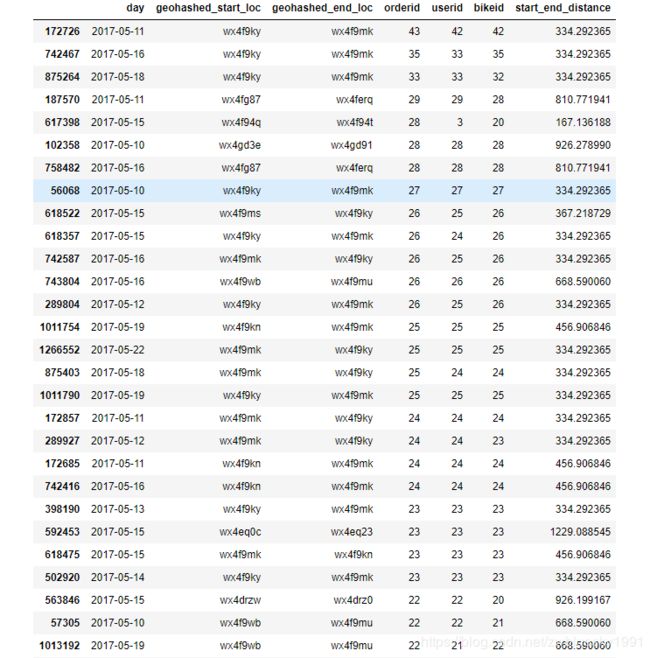
看到最多的也没超过50个。
结合上面每个范围每天的数据,是否可以预测安排每个点的单车数量?这些都有待继续探讨。
本文并未涉及到模型分析,待后面学习深入后,再回头补。
如果本文有错误或者不当之处,欢迎各位大佬留言评论,感谢!
