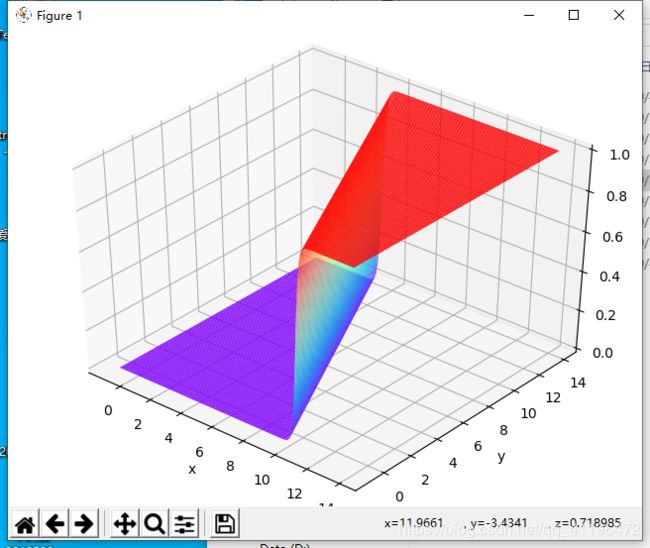
二分类线性分类器python实现(一)
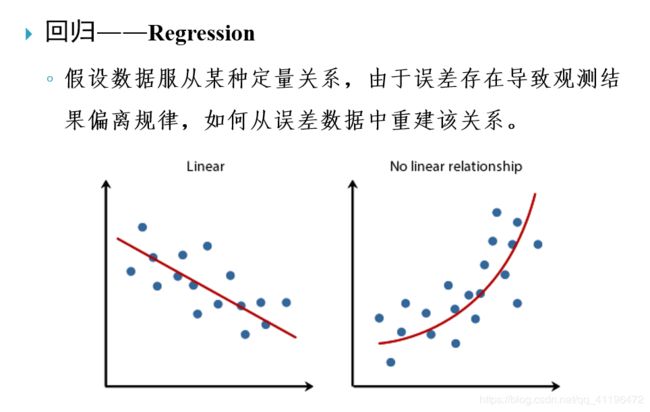
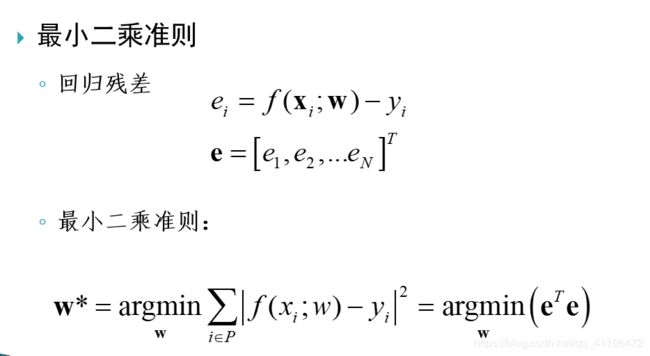
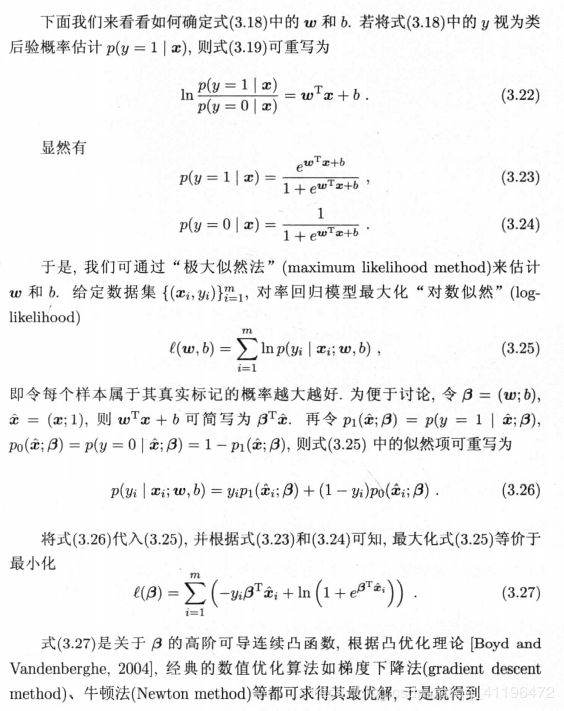
回归(Regression)与最小二乘法(Least squares)
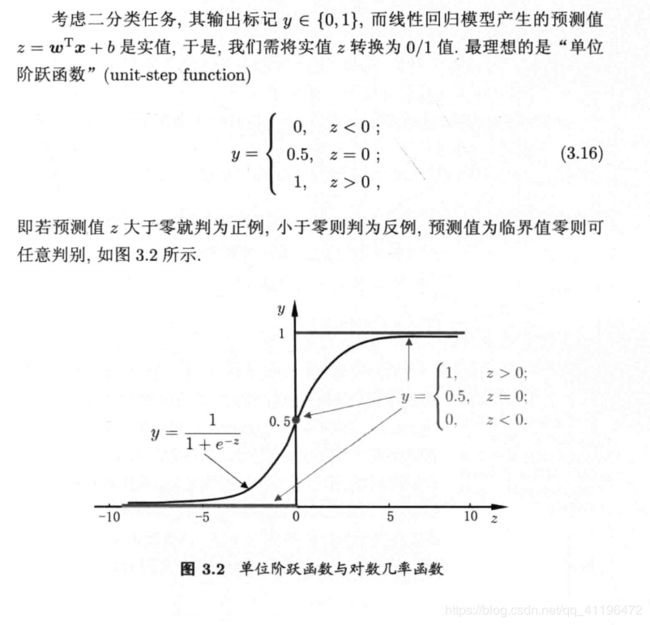
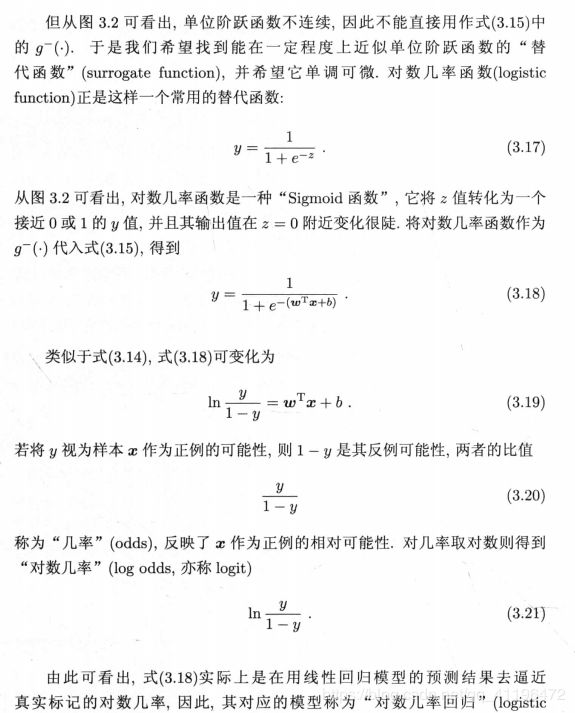
用回归方法解决分类问题
Python代码
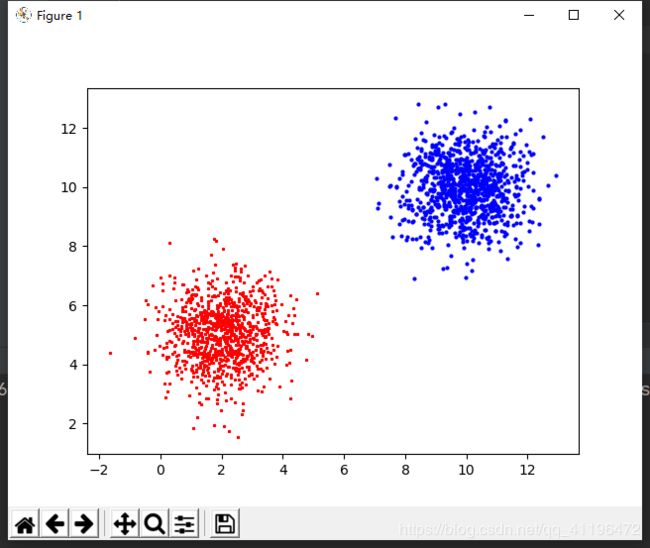
首先先生成数据集
import numpy as np
import matplotlib.pyplot as plt
import pickle


# 创建训练样本
N = 1000
# CLASS 1
x_c1 = np.random.randn(N, 2)
x_c1 = np.add(x_c1, [10, 10])
y_c1 = np.ones((N, 1), dtype=np.double)
# CLASS 2
x_c2 = np.random.randn(N, 2)
x_c2 = np.add(x_c2, [2, 5])
y_c2 = np.zeros((N, 1), dtype=np.double)
# 扩展权向量
ex_c1 = np.concatenate((x_c1, np.ones((N, 1))), 1)
ex_c2 = np.concatenate((x_c2, np.ones((N, 1))), 1)
# 生成数据
data_x = np.concatenate((ex_c1, ex_c2), 0)
data_y = np.concatenate((y_c1, y_c2), 0)

x1 = x_c1[:, 0].T
y1 = x_c1[:, 1].T
x2 = x_c2[:, 0].T
y2 = x_c2[:, 1].T

plt.plot(x1, y1, "bo", markersize=2)
plt.plot(x2, y2, "r*", markersize=2)
plt.show()

pickle_file = open('data_x.pkl', 'wb')
pickle.dump(data_x, pickle_file)
pickle_file.close()

pickle_file2 = open('data_y.pkl', 'wb')
pickle.dump(data_y, pickle_file2)
pickle_file2.close()
然后训练模型
from scipy.optimize import minimize
import numpy as np
import pickle
import matplotlib.pyplot as plt

pickle_file = open('data_x.pkl', 'rb')
data_x = pickle.load(pickle_file)
pickle_file.close()

pickle_file2 = open('data_y.pkl', 'rb')
data_y = pickle.load(pickle_file2)
pickle_file2.close()

N = np.size(data_y)


def fun(beta):
    sum = 0
    for j in range(N):
        sum += (-data_y[j] * np.dot(beta, data_x[j].T) + np.log(1 + np.exp(np.dot(beta, data_x[j].T))))
    return sum


def fun_jac(beta):

    jac = np.zeros(np.shape(beta), dtype=np.double)
    p1 = np.zeros(N, dtype=np.double)
    for j in range(N):
        p1[j] = np.exp(np.dot(beta, data_x[j].T)) / (1 + np.exp(np.dot(beta, data_x[j].T)))
        jac = jac - (data_x[j]) * (data_y[j] - p1[j])
    return jac


def fun_hess(beta):

    hess = np.zeros((np.size(beta), np.size(beta)), dtype=np.double)
    p1 = np.zeros(N, dtype=np.double)
    for j in range(N):
        p1[j] = np.exp(np.dot(beta, data_x[j].T)) / (1 + np.exp(np.dot(beta, data_x[j].T)))
        hess += np.dot(data_x[j], data_x[j].T) * p1[j] * (1 - p1[j])
    return hess


def callback(xk):
    print(xk)


def line(beta, x):

    return 1 / beta[1] * (- beta[0] * x - beta[2])


if __name__ == '__main__':

    beta0 = np.array([[1., 1., 1.]])

    res = minimize(fun, beta0, callback=callback, tol=1.e-14,
                   options={'disp': True})

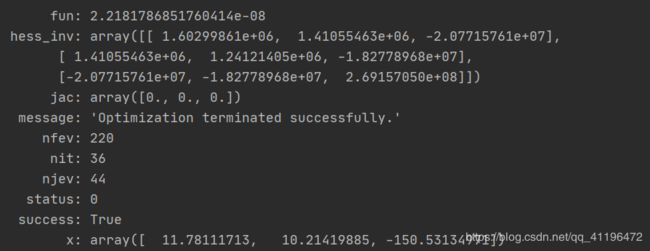
    print(res)

    n = 100
    # CLASS 1
    x_c1_test = np.random.randn(n, 2)
    x_c1_test = np.add(x_c1_test, [10, 10])
    ex_c1_test = np.concatenate((x_c1_test, np.ones((n, 1))), 1)  # 扩展权向量
    # CLASS 2
    x_c2_test = np.random.randn(n, 2)
    x_c2_test = np.add(x_c2_test, [2, 5])
    ex_c2_test = np.concatenate((x_c2_test, np.ones((n, 1))), 1)  # 扩展权向量

    data_x_test = np.concatenate((ex_c1_test, ex_c2_test), 0)

    x1 = x_c1_test[:, 0].T
    y1 = x_c1_test[:, 1].T
    x2 = x_c2_test[:, 0].T
    y2 = x_c2_test[:, 1].T

    X = np.linspace(0, 10, 1000)

    plt.plot(x1, y1, "b+", markersize=5)
    plt.plot(x2, y2, "r+", markersize=5)
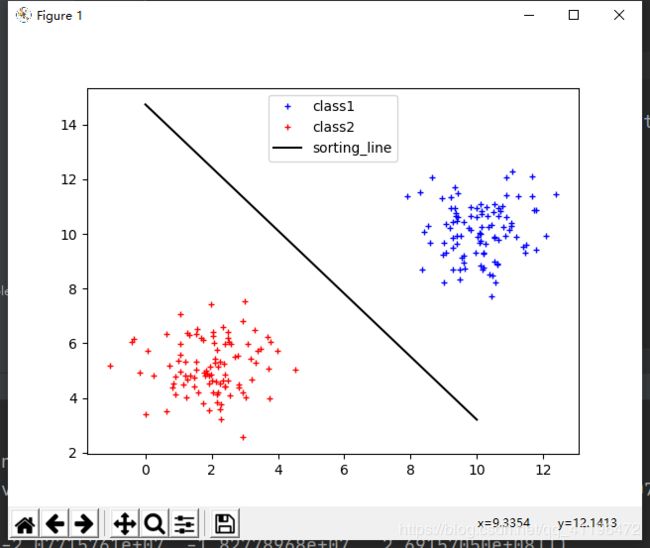
    plt.plot(X, line(res.x, X), linestyle="-", color="black")

    plt.show()

    beta_x_hat = np.zeros(2 * n)
    y_hat = np.zeros(2 * n)

    for i in range(2 * n):
        beta_x_hat[i] = np.dot(res.x, data_x_test[i].T)
        y_hat[i] = np.exp(beta_x_hat[i]) / (1 + np.exp(beta_x_hat[i]))

    print(y_hat)
测试数据
二元函数的图像如下:
