Kaggle实战(二):数据集特征分析与展示
本文对原始数据集中的特征进行分析与展示
import numpy as np # linear algebra
import pandas as pd # data processing, CSV file I/O
import matplotlib.pyplot as plt
from sklearn.preprocessing import LabelEncoder
import seaborn as sns
#color = sns.color_palette()

%matplotlib inline
dpath = 'F:/Python_demo/XGBoost/data/'
train = pd.read_json(dpath +"RentListingInquries_train.json")
train.head(3)
test = pd.read_json(dpath+"RentListingInquries_test.json")
#test.head().T
print("Train :", train.shape)
print("Test : ", test.shape)
train.info()Train : (49352, 15) Test : (74659, 14)
Int64Index: 49352 entries, 10 to 99994
Data columns (total 15 columns):
bathrooms          49352 non-null float64
bedrooms           49352 non-null int64
building_id        49352 non-null object
created            49352 non-null object
description        49352 non-null object
display_address    49352 non-null object
features           49352 non-null object
latitude           49352 non-null float64
listing_id         49352 non-null int64
longitude          49352 non-null float64
manager_id         49352 non-null object
photos             49352 non-null object
price              49352 non-null int64
street_address     49352 non-null object
interest_level     49352 non-null object
dtypes: float64(3), int64(3), object(9)
memory usage: 6.0+ MB
train.describe()  # 统计信息
train.isnull().sum()  # 缺失值个数
bathrooms 0 bedrooms 0 building_id 0 created 0 description 0 display_address 0 features 0 latitude 0 listing_id 0 longitude 0 manager_id 0 photos 0 price 0 street_address 0 interest_level 0 dtype: int64
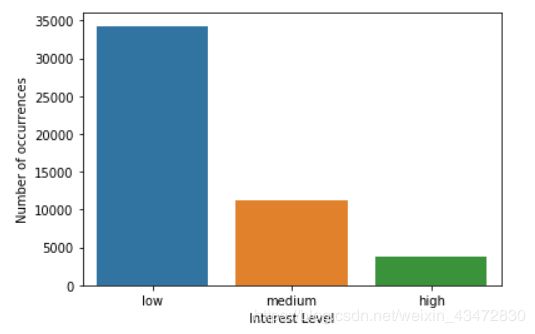
sns.countplot(train.interest_level, order=['low', 'medium', 'high']);  # 画出统计直方图
plt.xlabel('Interest Level');
plt.ylabel('Number of occurrences');
### Quantitative substitute of Interest Level 将标签与数字建立映射
train['interest'] = np.where(train.interest_level=='low', 0,
np.where(train.interest_level=='medium', 1, 2))
sns.countplot(train.interest, order=[0, 1, 2]);
plt.xlabel('interest');
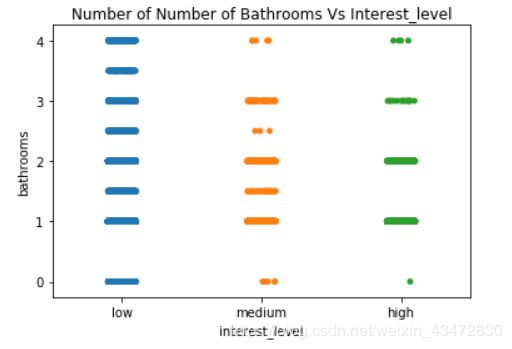
plt.ylabel('Number of occurrences');# 两个变量之间的散点图
order = ['low', 'medium', 'high']
sns.stripplot(train["interest_level"],train["bathrooms"],jitter=True,order=order) # jitter=True当数据重合较多时,用该参数做一些调整
plt.title("Number of Number of Bathrooms Vs Interest_level");# 数据预处理,大于95%分位数的都处理成同一值
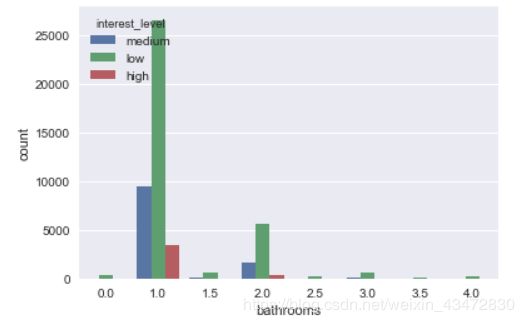
ulimit = np.percentile(train.bathrooms.values, 95)
train['bathrooms'].loc[train['bathrooms']>ulimit] = ulimit # bathrooms大于4时都置为4sns.countplot(x="bathrooms", hue="interest_level",data=train); # hue用于分类# 画出柱状图
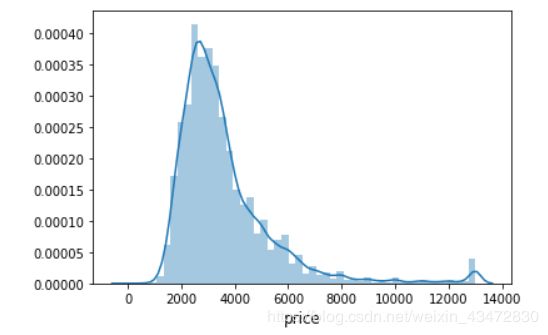
ulimit = np.percentile(train.price.values, 99) # 99%分位数
train['price'].loc[train['price']>ulimit] = ulimit
sns.distplot(train.price.values, bins=50, kde=True)
plt.xlabel('price', fontsize=12)
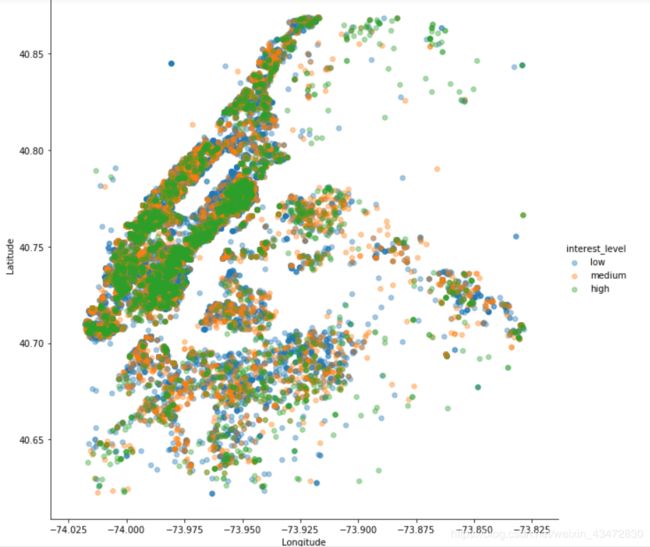
plt.show()# 地理位置,线性关系图
sns.lmplot(x="longitude", y="latitude", fit_reg=False, hue='interest_level',
hue_order=['low', 'medium', 'high'], height=9, scatter_kws={'alpha':0.4,'s':30},
data=train[(train.longitude>train.longitude.quantile(0.005))
&(train.longitudetrain.latitude.quantile(0.005))
&(train.latitude # 日期类型处理
train['created'] = pd.to_datetime(train['created'])
train['date'] = train['created'].dt.date
train["year"] = train["created"].dt.year
train['month'] = train['created'].dt.month
train['day'] = train['created'].dt.day
train['hour'] = train['created'].dt.hour
train['weekday'] = train['created'].dt.weekday
train['week'] = train['created'].dt.week
train['quarter'] = train['created'].dt.quarter
train['weekend'] = ((train['weekday'] == 5) & (train['weekday'] == 6))
train['wd'] = ((train['weekday'] != 5) & (train['weekday'] != 6))
cnt_srs = train['date'].value_counts()
plt.figure(figsize=(12,4))
ax = plt.subplot(111)
ax.bar(cnt_srs.index, cnt_srs.values)
ax.xaxis_date()
plt.xticks(rotation='vertical')
plt.show()from wordcloud import WordCloud
text = ''
text_da = ''
text_street = ''
#text_desc = ''
for ind, row in train.iterrows():
for feature in row['features']:
text = " ".join([text, "_".join(feature.strip().split(" "))])
text_da = " ".join([text_da,"_".join(row['display_address'].strip().split(" "))])
text_street = " ".join([text_street,"_".join(row['street_address'].strip().split(" "))])
#text_desc = " ".join([text_desc, row['description']])
text = text.strip()
text_da = text_da.strip()
text_street = text_street.strip()
#text_desc = text_desc.strip()
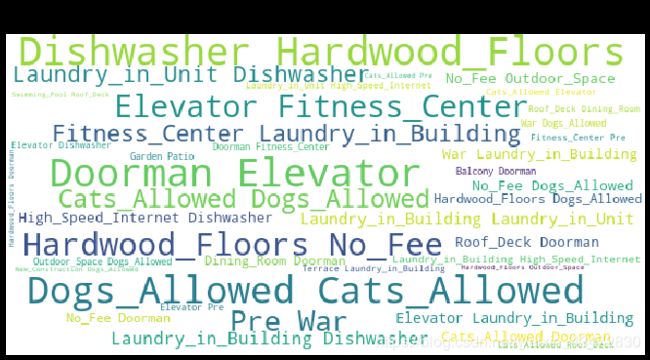
plt.figure(figsize=(12,6))
wordcloud = WordCloud(background_color='white', width=600, height=300, max_font_size=50, max_words=40).generate(text)
wordcloud.recolor(random_state=0)
plt.imshow(wordcloud)
plt.title("Wordcloud for features", fontsize=30)
plt.axis("off")
plt.show()
# wordcloud for display address
plt.figure()
wordcloud = WordCloud(background_color='white', width=600, height=300, max_font_size=50, max_words=40).generate(text_da)
wordcloud.recolor(random_state=0)
plt.imshow(wordcloud)
plt.title("Wordcloud for Display Address", fontsize=30)
plt.axis("off")
plt.show()
# wordcloud for street address
plt.figure()
wordcloud = WordCloud(background_color='white', width=600, height=300, max_font_size=50, max_words=40).generate(text_street)
wordcloud.recolor(random_state=0)
plt.imshow(wordcloud)
plt.title("Wordcloud for Street Address", fontsize=30)
plt.axis("off")
plt.show()


