线性LDA、k-means和SVM算法对数据集进行二分类可视化
文章目录
- 一、线性LDA
- 1、线性LDA含义
- 2、对鸢尾花数据集进行可视化分类
- 3、对月亮数据集进行可视化分类
- 二、k-means
- 1、k-means含义
- 2、对鸢尾花数据集进行可视化分类
- 3、对月亮数据集进行可视化分类
- 三、SVM
- 1、SVM含义
- 2、对鸢尾花数据集进行可视化分类
- 3、对月亮数据集进行可视化分类
- 4、SVM算法的优点
- 四、参考文献
一、线性LDA
1、线性LDA含义
线性判别式分析(Linear Discriminant Analysis),简称为LDA。也称为Fisher线性判别(Fisher Linear Discriminant,FLD)。
基本思想是将高维的模式样本投影到最佳鉴别矢量空间,以达到抽取分类信息和压缩特征空间维数的效果,投影后保证模式样本在新的子空间有最大的类间距离和最小的类内距离,即模式在该空间中有最佳的可分离性。
2、对鸢尾花数据集进行可视化分类
import numpy as np
import matplotlib.pyplot as plt
from sklearn.datasets.samples_generator import make_classification
from mpl_toolkits.mplot3d import Axes3D
def LDA(X, y):
    X1 = np.array([X[i] for i in range(len(X)) if y[i] == 0])
    X2 = np.array([X[i] for i in range(len(X)) if y[i] == 1])
    len1 = len(X1)
    len2 = len(X2)
    mju1 = np.mean(X1, axis=0)#求中心点
    mju2 = np.mean(X2, axis=0)
    cov1 = np.dot((X1 - mju1).T, (X1 - mju1))
    cov2 = np.dot((X2 - mju2).T, (X2 - mju2))
    Sw = cov1 + cov2
    w = np.dot(np.mat(Sw).I, (mju1 - mju2).reshape((len(mju1), 1)))  # 计算w
    X1_new = func(X1, w)
    X2_new = func(X2, w)
    y1_new = [1 for i in range(len1)]
    y2_new = [2 for i in range(len2)]
    return X1_new, X2_new, y1_new, y2_new
def func(x, w):
    return np.dot((x), w)
if '__main__' == __name__:
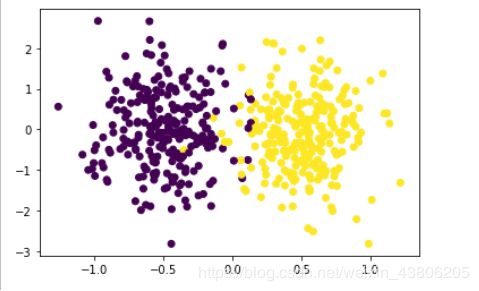
    X, y = make_classification(n_samples=500, n_features=2, n_redundant=0, n_classes=2,
                               n_informative=1, n_clusters_per_class=1, class_sep=0.5, random_state=10)
    plt.scatter(X[:, 0], X[:, 1], marker='o', c=y)
    plt.show()
3、对月亮数据集进行可视化分类
import numpy as np
import matplotlib.pyplot as plt
from sklearn import datasets
def LDA(X, y):
    #根据y等于0或1分类
    X1 = np.array([X[i] for i in range(len(X)) if y[i] == 0])
    X2 = np.array([X[i] for i in range(len(X)) if y[i] == 1])
    len1 = len(X1)
    len2 = len(X2)
    mju1 = np.mean(X1, axis=0)#求中心点
    mju2 = np.mean(X2, axis=0)
    cov1 = np.dot((X1 - mju1).T, (X1 - mju1))
    cov2=np.dot((X2 - mju2).T, (X2 - mju2))
    Sw = cov1 + cov2
    a=mju1-mju2
    a=(np.array([a])).T
    w=(np.dot(np.linalg.inv(Sw),a))
    X1_new =func(X1, w)
    X2_new = func(X2, w)
    y1_new = [1 for i in range(len1)]
    y2_new = [2 for i in range(len2)]
def func(x, w):
    return np.dot((x), w)
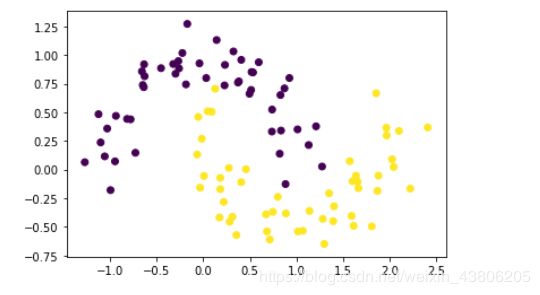
X, y = datasets.make_moons(n_samples=100, noise=0.15, random_state=42)
plt.scatter(X[:, 0], X[:, 1], marker='o', c=y)
plt.show()
二、k-means
1、k-means含义
k-means是用均值算法把数据分成K个类的算法,算法流程如下所示:
①从数据中随机抽取k个点作为初始聚类的中心,由这个中心代表各个聚类;
②计算数据中所有的点到这k个点的距离,将点归到离其最近的聚类里;
③调整聚类中心,即将聚类的中心移动到聚类的几何中心(即平均值)处,也就是k-means中的mean的含义;
④重复第2、3步直到聚类的中心不再移动,此时算法收敛。
2、对鸢尾花数据集进行可视化分类
from sklearn import datasets
import matplotlib.pyplot as plt
import numpy as np
import json
from sklearn.cluster import KMeans
path = u'C:/Users/LOL/Desktop/new.csv'
csv_file= np.loadtxt(open(path,encoding='UTF-8-sig'),dtype=np.str,delimiter=None,unpack=False)
#划分得到训练指标数组
data=[]
for i in range(len(csv_file)):
    str_list=csv_file[i].strip(',').split(',')
    del str_list[0]
    del str_list[0]
    del str_list[2]
    da=[]
    for j in range(len(str_list)):
        da.append(float(str_list[j]))
    data.append(da)
temp = np.array(data)
train=temp[:,0:2]#训练指标数组
#训练指标数组两个维度作为x轴和y轴
x = train[:,0]
y = train[:,1]
#分为3类
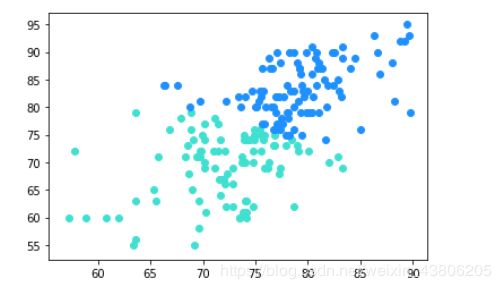
model = KMeans(n_clusters=2)
#训练模型
model.fit(train)
#预测全部学生数据
#打印出来对全部学生数据的聚类散点图
all_predictions = model.predict(train)
for i in range(len(all_predictions)):
    if all_predictions[i] == 0:
        plt.scatter(x[i], y[i], c='#1E90FF')#第一种分类学生:蓝色
    elif all_predictions[i] == 1:
        plt.scatter(x[i], y[i], c='#40E0D0')#第二种分类学生:绿色
#plt.scatter(x, y, c=all_predictions)
plt.show()
3、对月亮数据集进行可视化分类
from sklearn.datasets import make_moons
import matplotlib.pyplot as plt
from sklearn.cluster import KMeans
import numpy as np
X, y = make_moons(n_samples=100, noise=0.15, random_state=42)
X1=X[:,0]
X2=X[:,1]
#分为2类
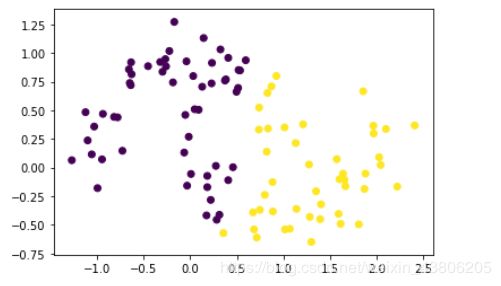
model = KMeans(n_clusters=2)
#训练模型
model.fit(X)
prddicted_label= model.predict([[-0.22452786,1.01733299]])
all_predictions = model.predict(X)
plt.scatter(X1, X2, c=all_predictions)
plt.show()
三、SVM
1、SVM含义
支持向量机(support vector machines, SVM)是一种二分类模型,它的基本模型是定义在特征空间上的间隔最大的线性分类器,间隔最大使它有别于感知机;SVM还包括核技巧,这使它成为实质上的非线性分类器。SVM的的学习策略就是间隔最大化,可形式化为一个求解凸二次规划的问题,也等价于正则化的合页损失函数的最小化问题。SVM的的学习算法就是求解凸二次规划的最优化算法。
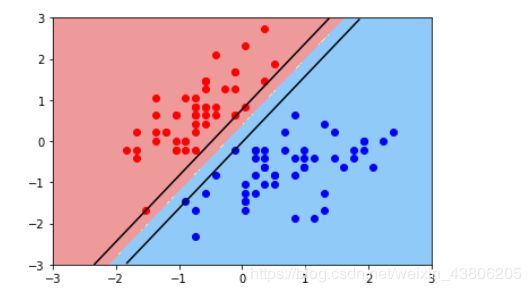
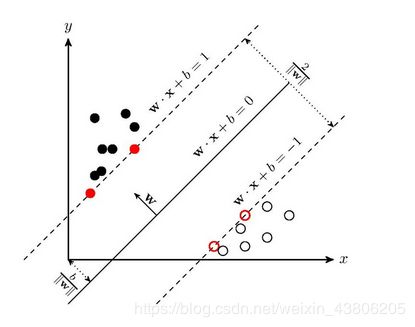
线性SVM学习的基本想法是求解能够正确划分训练数据集并且几何间隔最大的分离超平面。如下图所示,w.x+b=0 即为分离超平面,对于线性可分的数据集来说,这样的超平面有无穷多个(即感知机),但是几何间隔最大的分离超平面却是唯一的。
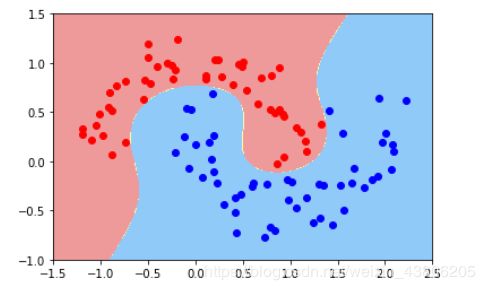
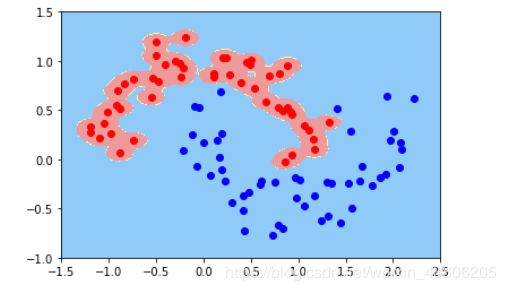
非线性SVM算法原理是对于输入空间中的非线性分类问题,可以通过非线性变换将它转化为某个维特征空间中的线性分类问题,在高维特征空间中学习线性支持向量机。由于在线性支持向量机学习的对偶问题里,目标函数和分类决策函数都只涉及实例和实例之间的内积,所以不需要显式地指定非线性变换,而是用核函数替换当中的内积。核函数表示,通过一个非线性转换后的两个实例间的内积。具体地, K(x,z) 是一个函数,或正定核,意味着存在一个从输入空间到特征空间的映射 φ(x) ,对任意输入空间中的 x,z,有
K(x,z)=φ(x)(z)
在线性支持向量机学习的对偶问题中,用核函数 K(x,z)替代内积,求解得到的就是非线性支持向量机

2、对鸢尾花数据集进行可视化分类
①线性svm
import numpy as np
from sklearn.datasets import load_iris
import matplotlib.pyplot as plt
from sklearn.preprocessing import StandardScaler
from sklearn.svm import LinearSVC
from matplotlib.colors import ListedColormap
import warnings
def plot_decision_boundary(model,axis):
    x0,x1=np.meshgrid(
        np.linspace(axis[0],axis[1],int((axis[1]-axis[0])*100)).reshape(-1,1),
        np.linspace(axis[2],axis[3],int((axis[3]-axis[2])*100)).reshape(-1,1)
    )
    x_new=np.c_[x0.ravel(),x1.ravel()]
    y_predict=model.predict(x_new)
    zz=y_predict.reshape(x0.shape)
    custom_cmap=ListedColormap(['#EF9A9A','#FFF59D','#90CAF9'])
    plt.contourf(x0,x1,zz,linewidth=5,cmap=custom_cmap)
    w = model.coef_[0]
    b = model.intercept_[0]
    plot_x = np.linspace(axis[0],axis[1],200)
    up_y = -w[0]/w[1]*plot_x - b/w[1] + 1/w[1]
    down_y = -w[0]/w[1]*plot_x - b/w[1] - 1/w[1]
    up_index = (up_y>=axis[2]) & (up_y<=axis[3])
    down_index = (down_y>=axis[2]) & (down_y<=axis[3])
    plt.plot(plot_x[up_index],up_y[up_index],c='black')
    plt.plot(plot_x[down_index],down_y[down_index],c='black')
warnings.filterwarnings("ignore")
data = load_iris()
x = data.data
y = data.target
x = x[y<2,:2]
y = y[y<2]
scaler = StandardScaler()
scaler.fit(x)
x = scaler.transform(x)
svc = LinearSVC(C=1e9)
svc.fit(x,y)
plot_decision_boundary(svc,axis=[-3,3,-3,3])
plt.scatter(x[y==0,0],x[y==0,1],c='r')
plt.scatter(x[y==1,0],x[y==1,1],c='b')
plt.show()
import numpy as np
from sklearn import datasets
import matplotlib.pyplot as plt
from sklearn.preprocessing import PolynomialFeatures,StandardScaler
from sklearn.svm import LinearSVC
from sklearn.pipeline import Pipeline
from matplotlib.colors import ListedColormap
import warnings
def plot_decision_boundary(model,axis):
    x0,x1=np.meshgrid(
        np.linspace(axis[0],axis[1],int((axis[1]-axis[0])*100)).reshape(-1,1),
        np.linspace(axis[2],axis[3],int((axis[3]-axis[2])*100)).reshape(-1,1)
    )
    x_new=np.c_[x0.ravel(),x1.ravel()]
    y_predict=model.predict(x_new)
    zz=y_predict.reshape(x0.shape)
    custom_cmap=ListedColormap(['#EF9A9A','#FFF59D','#90CAF9'])
    plt.contourf(x0,x1,zz,linewidth=5,cmap=custom_cmap)
def PolynomialSVC(degree,C=1.0):
    return Pipeline([
        ('poly',PolynomialFeatures(degree=degree)),
        ('std_scaler',StandardScaler()),
        ('linearSVC',LinearSVC(C=1e9))
    ])
warnings.filterwarnings("ignore")
poly_svc = PolynomialSVC(degree=3)
X,y = datasets.make_moons(noise=0.15,random_state=666)
poly_svc.fit(X,y)
plot_decision_boundary(poly_svc,axis=[-1.5,2.5,-1.0,1.5])
plt.scatter(X[y==0,0],X[y==0,1],c='red')
plt.scatter(X[y==1,0],X[y==1,1],c='blue')
plt.show()
from sklearn.preprocessing import StandardScaler
from sklearn.svm import SVC
from sklearn.pipeline import Pipeline
from sklearn import datasets
from matplotlib.colors import ListedColormap
import numpy as np
import matplotlib.pyplot as plt
import warnings
def plot_decision_boundary(model,axis):
    x0,x1=np.meshgrid(
        np.linspace(axis[0],axis[1],int((axis[1]-axis[0])*100)).reshape(-1,1),
        np.linspace(axis[2],axis[3],int((axis[3]-axis[2])*100)).reshape(-1,1)
    )
    x_new=np.c_[x0.ravel(),x1.ravel()]
    y_predict=model.predict(x_new)
    zz=y_predict.reshape(x0.shape)
    custom_cmap=ListedColormap(['#EF9A9A','#FFF59D','#90CAF9'])
    plt.contourf(x0,x1,zz,linewidth=5,cmap=custom_cmap)
def RBFKernelSVC(gamma=1.0):
    return Pipeline([
        ('std_scaler',StandardScaler()),
        ('svc',SVC(kernel='rbf',gamma=gamma))
    ])
warnings.filterwarnings("ignore")
X,y = datasets.make_moons(noise=0.15,random_state=666)
svc = RBFKernelSVC(gamma=100)
svc.fit(X,y)
plot_decision_boundary(svc,axis=[-1.5,2.5,-1.0,1.5])
plt.scatter(X[y==0,0],X[y==0,1],c='red')
plt.scatter(X[y==1,0],X[y==1,1],c='blue')
plt.show()
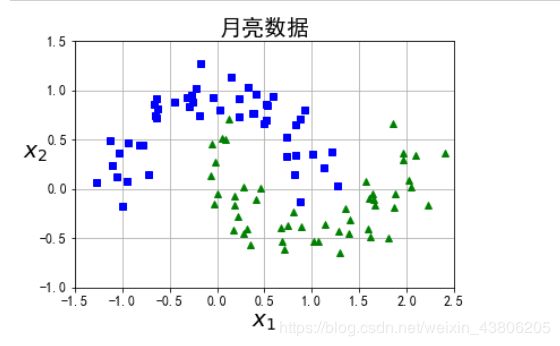
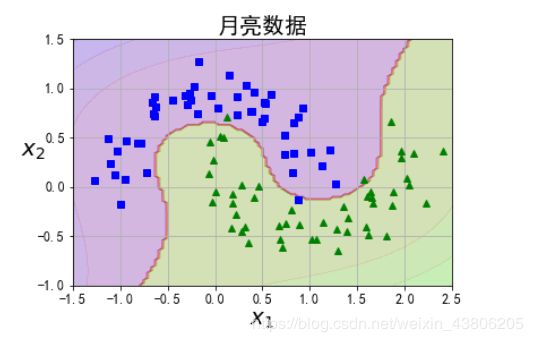
3、对月亮数据集进行可视化分类
from sklearn.datasets import make_moons
X, y = make_moons(n_samples=100, noise=0.15, random_state=42)
def plot_dataset(X, y, axes):
    plt.plot(X[:, 0][y==0], X[:, 1][y==0], "bs")
    plt.plot(X[:, 0][y==1], X[:, 1][y==1], "g^")
    plt.axis(axes)
    plt.grid(True, which='both')
    plt.xlabel(r"$x_1$", fontsize=20)
    plt.ylabel(r"$x_2$", fontsize=20, rotation=0)
    plt.title("月亮数据",fontsize=20)
plot_dataset(X, y, [-1.5, 2.5, -1, 1.5])
plt.show()
from sklearn.datasets import make_moons
from sklearn.pipeline import Pipeline
from sklearn.preprocessing import PolynomialFeatures
polynomial_svm_clf = Pipeline([
        # 将源数据 映射到 3阶多项式
        ("poly_features", PolynomialFeatures(degree=3)),
        # 标准化
        ("scaler", StandardScaler()),
        # SVC线性分类器
        ("svm_clf", LinearSVC(C=10, loss="hinge", random_state=42))
    ])
polynomial_svm_clf.fit(X, y)
def plot_predictions(clf, axes):
    # 打表
    x0s = np.linspace(axes[0], axes[1], 100)
    x1s = np.linspace(axes[2], axes[3], 100)
    x0, x1 = np.meshgrid(x0s, x1s)
    X = np.c_[x0.ravel(), x1.ravel()]
    y_pred = clf.predict(X).reshape(x0.shape)
    y_decision = clf.decision_function(X).reshape(x0.shape)
    plt.contourf(x0, x1, y_pred, cmap=plt.cm.brg, alpha=0.2)
    plt.contourf(x0, x1, y_decision, cmap=plt.cm.brg, alpha=0.1)
plot_predictions(polynomial_svm_clf, [-1.5, 2.5, -1, 1.5])
plot_dataset(X, y, [-1.5, 2.5, -1, 1.5])
plt.show()
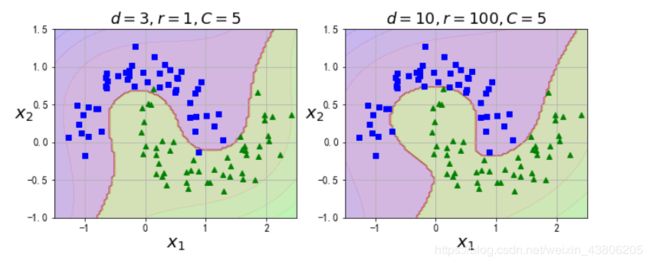
from sklearn.svm import SVC
poly_kernel_svm_clf = Pipeline([
        ("scaler", StandardScaler()),
        ("svm_clf", SVC(kernel="poly", degree=3, coef0=1, C=5))
    ])
poly_kernel_svm_clf.fit(X, y)
poly100_kernel_svm_clf = Pipeline([
        ("scaler", StandardScaler()),
        ("svm_clf", SVC(kernel="poly", degree=10, coef0=100, C=5))
    ])
poly100_kernel_svm_clf.fit(X, y)
plt.figure(figsize=(11, 4))
plt.subplot(121)
plot_predictions(poly_kernel_svm_clf, [-1.5, 2.5, -1, 1.5])
plot_dataset(X, y, [-1.5, 2.5, -1, 1.5])
plt.title(r"$d=3, r=1, C=5$", fontsize=18)
plt.subplot(122)
plot_predictions(poly100_kernel_svm_clf, [-1.5, 2.5, -1, 1.5])
plot_dataset(X, y, [-1.5, 2.5, -1, 1.5])
plt.title(r"$d=10, r=100, C=5$", fontsize=18)
plt.show()
4、SVM算法的优点
①使用核函数可以向高维空间进行映射
②使用核函数可以解决非线性的分类
③分类思想很简单,就是将样本与决策面的间隔最大化
④分类效果较好
四、参考文献
1、https://zhuanlan.zhihu.com/p/31886934
2、https://blog.csdn.net/u010916338/article/details/86487890
3、https://www.cnblogs.com/lsm-boke/p/11761534.html
4、https://blog.csdn.net/z962013489/article/details/79871789
