线性模型第3讲:Lasso方法
论文合作、课题指导请联系QQ2279055353
Lasso是一种估计稀疏稀疏的线性模型。稀疏系数,就是系数里有很多是零。它可以用来减少特征数,在特定情况下,Lasso方法也能够精确地恢复非零特征集。数学上,Lasso由一个带有惩罚项的线性模型组成,最小化的目标函数:
min w 1 2 n ∥ X w − y ∥ 2 2 + α ∥ w ∥ 1 \mathop{\min}\limits_{w}\dfrac{1}{2n} \| Xw-y\|_2^2+\alpha\|w\|_1 wmin2n1∥Xw−y∥22+α∥w∥1
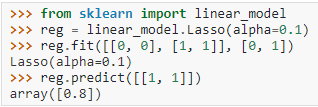
这样,lasso估计量解决了带有 α ∥ w ∥ 1 \alpha\|w\|_1 α∥w∥1 惩罚项的最小二乘问题。这里, α > 0 \alpha>0 α>0 是常数, ∥ w ∥ 1 \|w\|_1 ∥w∥1 是系数向量的 l 1 l_1 l1 范数。Lasso类使用coordinate descent算法执行。下面,我们举一个简单的数值例子。

设置正则参数
在lasso方法里,参数 α \alpha α 控制估计系数的稀疏程度。那么,如何选择 α \alpha α 呢?
交叉验证法
LassoCV类和LassoLarsCV类根据最小角回归算法确定。对于具有多重共线性的高维数据,LassoCV通常是首选。然而,LassoLarsCV更适合探索相关的 α \alpha α 值。当样本数远小于特征数时,它要快于LassoCV.
基于信息准则的模型选择
LassoLarsIC类使用赤池信息量AIC和贝叶斯信息准则BIC. 在使用k-fold CV时,它在 α \alpha α 的正则路径里找到最优值,计算上更便宜。然而,该准则需要对自由度的适当估计。
多任务Lasso
MultiTaskLasso类用来估计多维回归问题的稀疏系数,即, y y y 是一个二维数组,形如(n_samples, n_tasks). 它的约束条件为:被选择的特征对于所有回归问题是相同的。数学上,多任务Lasso由一个带有 l 1 , l 2 l_1, l_2 l1,l2 双约束的线性模型组成。目标函数最小化
min w 1 2 n ∥ X W − y ∥ F r o 2 + α ∥ W ∥ 21 \mathop{\min}\limits_{w}\dfrac{1}{2n} \| XW-y\|_{Fro}^2+\alpha\|W\|_{21} wmin2n1∥XW−y∥Fro2+α∥W∥21
F r o Fro Fro表示Frobenius范数,即,
∥ A ∥ F r o = ∑ i j a i j 2 \|A\|_{Fro}=\sqrt{\mathop{\sum\limits_{ij}}a_{ij}^2} ∥A∥Fro=ij∑aij2
∥ A ∥ 21 = ∑ i ∑ j a i j 2 \|A\|_{21}=\mathop{\sum}\limits_i\sqrt{\mathop{\sum}\limits_ja_{ij}^2} ∥A∥21=i∑j∑aij2
Lasso 模型选择实例
本例中,我们使用diabetes数据集演示CV/AIC/BIC在Lasso估计量里选择最优的 α \alpha α 的表现。diabetes数据集有442个样本,10个特征。结果如下图所示

Python代码
print(__doc__)

# Author: Olivier Grisel, Gael Varoquaux, Alexandre Gramfort
# License: BSD 3 clause

import time

import numpy as np
import matplotlib.pyplot as plt

from sklearn.linear_model import LassoCV, LassoLarsCV, LassoLarsIC
from sklearn import datasets

# This is to avoid division by zero while doing np.log10
EPSILON = 1e-4

X, y = datasets.load_diabetes(return_X_y=True)

rng = np.random.RandomState(42)
X = np.c_[X, rng.randn(X.shape[0], 14)]  # add some bad features

# normalize data as done by Lars to allow for comparison
X /= np.sqrt(np.sum(X ** 2, axis=0))

# #############################################################################
# LassoLarsIC: least angle regression with BIC/AIC criterion

model_bic = LassoLarsIC(criterion='bic')
t1 = time.time()
model_bic.fit(X, y)
t_bic = time.time() - t1
alpha_bic_ = model_bic.alpha_

model_aic = LassoLarsIC(criterion='aic')
model_aic.fit(X, y)
alpha_aic_ = model_aic.alpha_


def plot_ic_criterion(model, name, color):
    alpha_ = model.alpha_ + EPSILON
    alphas_ = model.alphas_ + EPSILON
    criterion_ = model.criterion_
    plt.plot(-np.log10(alphas_), criterion_, '--', color=color,
             linewidth=3, label='%s criterion' % name)
    plt.axvline(-np.log10(alpha_), color=color, linewidth=3,
                label='alpha: %s estimate' % name)
    plt.xlabel('-log(alpha)')
    plt.ylabel('criterion')


plt.figure()
plot_ic_criterion(model_aic, 'AIC', 'b')
plot_ic_criterion(model_bic, 'BIC', 'r')
plt.legend()
plt.title('Information-criterion for model selection (training time %.3fs)'
          % t_bic)

# #############################################################################
# LassoCV: coordinate descent

# Compute paths
print("Computing regularization path using the coordinate descent lasso...")
t1 = time.time()
model = LassoCV(cv=20).fit(X, y)
t_lasso_cv = time.time() - t1

# Display results
m_log_alphas = -np.log10(model.alphas_ + EPSILON)

plt.figure()
ymin, ymax = 2300, 3800
plt.plot(m_log_alphas, model.mse_path_, ':')
plt.plot(m_log_alphas, model.mse_path_.mean(axis=-1), 'k',
         label='Average across the folds', linewidth=2)
plt.axvline(-np.log10(model.alpha_ + EPSILON), linestyle='--', color='k',
            label='alpha: CV estimate')

plt.legend()

plt.xlabel('-log(alpha)')
plt.ylabel('Mean square error')
plt.title('Mean square error on each fold: coordinate descent '
          '(train time: %.2fs)' % t_lasso_cv)
plt.axis('tight')
plt.ylim(ymin, ymax)

# #############################################################################
# LassoLarsCV: least angle regression

# Compute paths
print("Computing regularization path using the Lars lasso...")
t1 = time.time()
model = LassoLarsCV(cv=20).fit(X, y)
t_lasso_lars_cv = time.time() - t1

# Display results
m_log_alphas = -np.log10(model.cv_alphas_ + EPSILON)

plt.figure()
plt.plot(m_log_alphas, model.mse_path_, ':')
plt.plot(m_log_alphas, model.mse_path_.mean(axis=-1), 'k',
         label='Average across the folds', linewidth=2)
plt.axvline(-np.log10(model.alpha_), linestyle='--', color='k',
            label='alpha CV')
plt.legend()

plt.xlabel('-log(alpha)')
plt.ylabel('Mean square error')
plt.title('Mean square error on each fold: Lars (train time: %.2fs)'
          % t_lasso_lars_cv)
plt.axis('tight')
plt.ylim(ymin, ymax)

plt.show()