深度学习 | 实战7- 连体网络MINIST优化
————————————————————————————
原文发表于夏木青 | JoselynZhao Blog,欢迎访问博文原文。
————————————————————————————
Github源码
深度学习教程与实战案列系列文章
深度学习 | 绪论
深度学习 | 线性代数基础
深度学习 | 机器学习基础
深度学习 | 实践方法论
深度学习 | 应用
深度学习 | 安装conda、opencv、pycharm以及相关问题
深度学习 | 工具及实践(TensorFlow)
深度学习 | TensorFlow 命名机制和变量共享、变量赋值与模型封装
深度学习 | TFSlim介绍
深度学习 | TensorFlow可视化
深度学习 | 训练及优化方法
深度学习 | 模型评估与梯度下降优化
深度学习 | 物体检测
深度学习| 实战1-python基本操作
深度学习 | 实战2-TensorFlow基础
深度学习 | 实战3-设计变量共享网络进行MNIST分类
深度学习 | 实战4-将LENET封装为class,并进行分类
深度学习 | 实战5-用slim 定义Lenet网络,并训练测试
深度学习 | 实战6-利用tensorboard实现卷积可视化
深度学习 | 实战7- 连体网络MINIST优化
深度学习 | 实战8 - 梯度截断
深度学习 | 实战9- 参数正则化
要求
输入为两个MNIST图片,以及两者是否为相同数字的标签(0为相同数字,1为不同数字),输出为网络给出两者是否为同一数字的预测结果。
网络结构可以自己设计。比如两层网络:hidden1:784(28x28)->500; hidden2: 500->10,使用relu。也可以尝试Lenet网络或其他结构。
要求:1. 构建平衡测试集:(1)正例(同一数字对)、反例(不同数字对)样例比为1:1。(2)正例中,10个数字类型各占1/10。反例中,不同数字对的所有组合共C^2_10=45种,要求比例也为相同,即反例中,45种组合每个组合比例为1/45。
测试集正反例总数不少于9000个。(注意,如果要对平衡的测试集有良好的效果,训练的数据集,也应该是平衡的。即我们课上讲的,训练、测试的数据分布要一致。否则,训练的模型是不符合任务需求的。)
写一个测试集打印脚本,打印出构建好的测试集中类型数量信息,例如下:
Positive (0,0): 450
Positive (1,1): 450
…
Positive (9,9): 450
Pos Total:4500
Negtive (0,1): 100
Negtive (0,2): 100
…
Negtive (8,9): 100
Neg Total:4500
Total: 9000
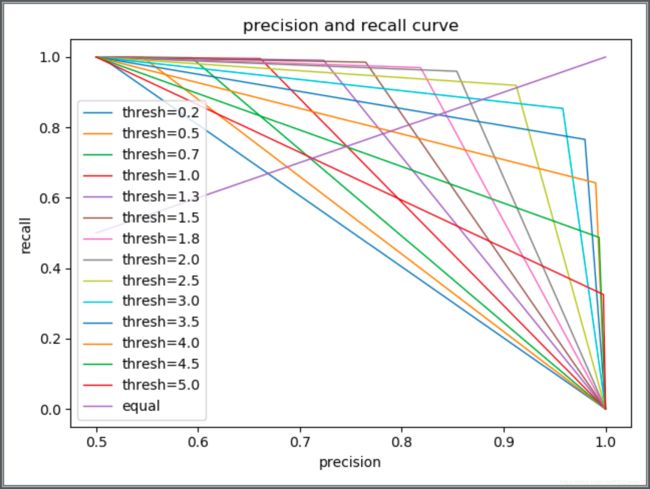
- 训练好网络后(ACC>0.9),根据不同正反例分类阈值绘制P-R曲线并计算AP值。
提交:代码,文档(运行截图,结果截图(包括PR曲线,测试集数量统计打印列表等))
实验与结果
运行截图
图 1 实验运行截图
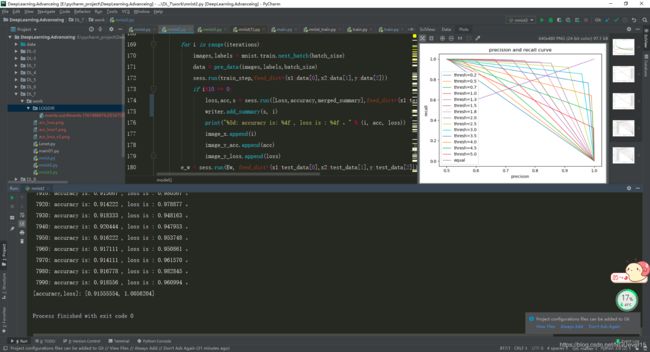
截图所在运行设备为window10(i7-8700),自己的笔记本跑起来太费力了,只有用实验室的设备调参了。
最终参数配置
图 2 最终参数配置截图

在整个实验的过程中,初步完成模型之后,经过了非常多次的参数调整,一开始会出现accuracy稳步在0.5 不下降的情况,后来调整了loss函数之后得到了改善。
Batch_size可设置的最小值为900。数据的预处理和数据平衡没有使用老师提供的代码,而是自己实现的,其中要求batch_size必须为10 和 45 和公倍数才能做到数据的完全平衡。
网络采用的是两层全连接网络,最开始两层网络的激活函数全都使用的relu,但发现参数怎么调准确率都上不去,还长出现nan的情况。最后将第一层全连接的激活函数换为了sigmoid。
Tensorboard视图查看
图 4 tensorboard accuracy和loss的变化情况
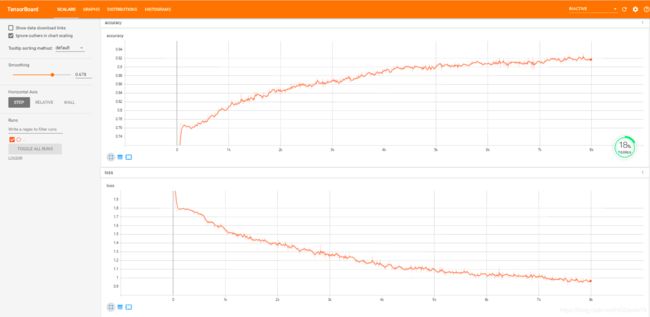
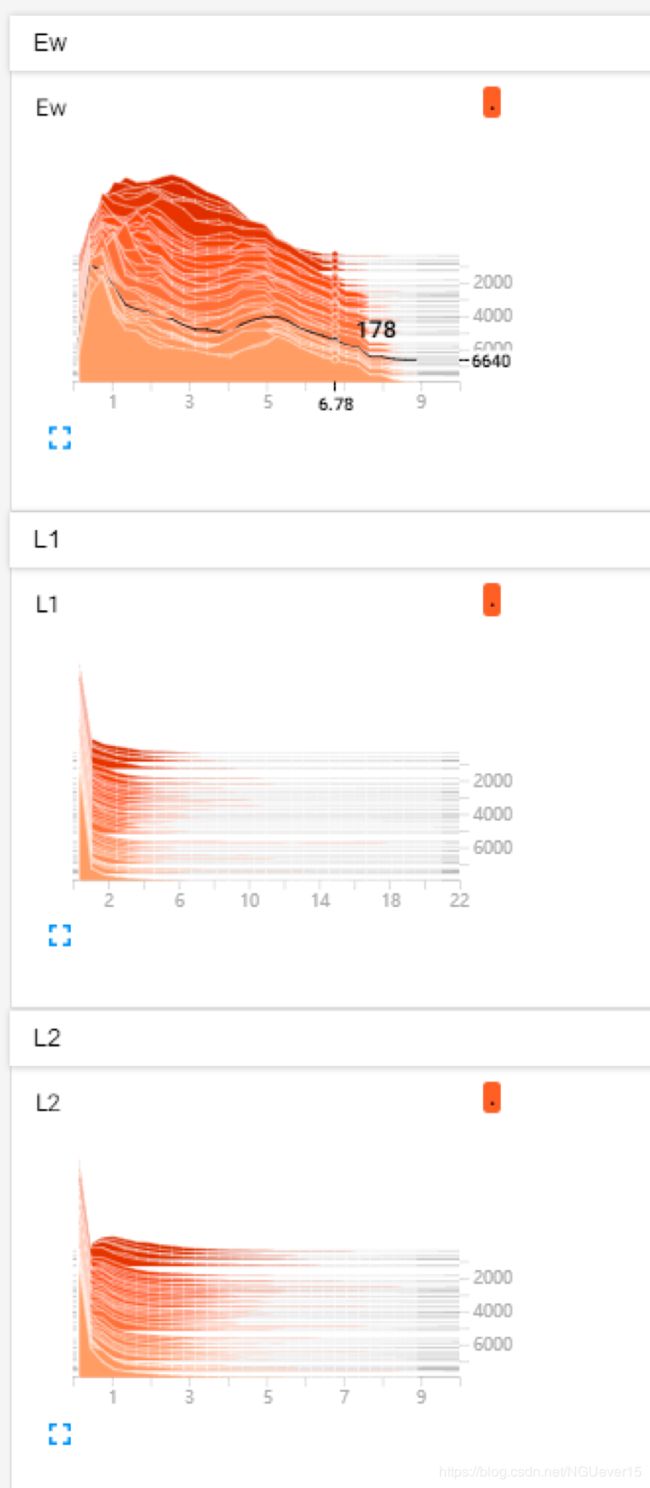
图 6 tensorboard 网络参数和prediction值

测试集脚本运行结果
图 7 测试集脚本运行结果
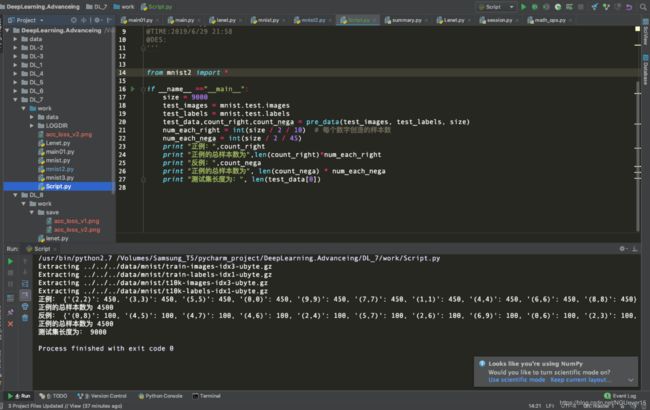
截图所在运行设备为MacOS(i5)。自己的笔记本电脑跑个脚本还是没有问题滴。
源码展示
mnist
mnist = input_data.read_data_sets('../../../data/mnist', one_hot=True)

def pre_data(images,labels,size):
    '''
    :param data: 待处理的数据集
    :param size: 目标样本数量
    :return: 处理后的数据集
    '''

    '''分别取出10是数字'''
    len_data = len(images)
    from_0_to_9 = [[],[],[],[],[],[],[],[],[],[]]
    for i in range(len_data): #对数据集进行遍历
        for j in range(10): #对0-9进行遍历
            if labels[i][j] == 1:
                from_0_to_9[j].append(images[i])

    image1 = []  # 存在第一个图像
    image2 = []  # 存放第二个图像
    label = []  # 存在label
    count_list_right = {}  # 设计为字典
    count_list_nega = {}  # 设计为字典

    '''下面考虑正例,每个数字占(size/2)的1/10'''
    num_each_right = int(size/2/10)  #每个数字创造的样本数
    num_each_nega = int(size / 2 / 45)
    for i in range(10):  #对每个数字做遍历
        isbreak = 0
        count =0 #当前样本数为0
        len_i = len(from_0_to_9[i]) # 获取当前这个数字对应的样本数量
        for j in  range(len_i): # 对这个数字对应的样本做遍历
            if isbreak:
                break
            for k in range(len_i): # 对这个数字对应的样本进行二重遍历
                if j==k :
                    continue
                image1.append(from_0_to_9[i][j])
                image2.append(from_0_to_9[i][k])
                label.append([0])
                count+=1
                if count>=num_each_right:
                    count_list_right["(%d,%d)"%(i,i)]=count
                    isbreak = 1
                    break
                    #跳出两层for循环
    # print(count_list_right)
    # print(len(count_list_right),len(count_list_right)*num_each_right)

    '''下面考虑负样本'''
    for i in range(10): # 对0-9遍历
        for j in range(i+1,10): #仍对0-9遍历
            for count in range(num_each_nega): #构造这num_each_nega多个样本数据
                image1.append(from_0_to_9[i][count])
                image2.append(from_0_to_9[j][count])
                label.append([1])
            count_list_nega["(%d,%d)"%(i,j)]=num_each_nega

    # print(count_list_nega)
    # print(len(count_list_nega), len(count_list_nega)*num_each_nega)

    '''组合数据'''
    data = []
    data.append(image1)
    data.append(image2)
    data.append(label)
    return data,count_list_right,count_list_nega


''' 下面设计网络部分'''

def fully_connected_layer(scope_name,x,W_name,b_name,W_shape,reuse = False):
    with tf.variable_scope(scope_name) as scope:
        if reuse:
            scope.reuse_variables()
        fc_W = tf.get_variable(W_name, initializer=tf.truncated_normal(W_shape, stddev=0.1))
        fc_b = tf.get_variable(b_name, initializer=tf.zeros(W_shape[1]))
        tf.summary.histogram("weights", fc_W)
        tf.summary.histogram("biases", fc_b)
        fc = tf.matmul(x, fc_W) + fc_b
        return fc

def net(x,scope_name='net'):
    with tf.variable_scope(scope_name,reuse=tf.AUTO_REUSE):
        fc0 = fully_connected_layer("fc1",x,"fc1_w","fc1_b",[784,500])
        fc0 = tf.nn.sigmoid(fc0)
        fc1 = fully_connected_layer("fc2",fc0,"fc2_w","fc2_b",[500,10])
        fc1 = tf.nn.relu(fc1)
        return fc1

def model():
    Q = tf.constant([5.0])
    thresh = 2.5
    iterations = 8000
    lr = 0.05
    batch_size = 900

    x1 = tf.placeholder(tf.float32, [None, 784], name="x1")
    x2 = tf.placeholder(tf.float32, [None, 784], name="x2")
    y = tf.placeholder(tf.float32, [None,1], name="y")
    # y2 = tf.placeholder(tf.float32, [None, 10], name="y2")
    net1 = net(x1)
    net2 = net(x2)
    y_ = tf.reshape(y,[-1])
    # tf.summary.histogram("net1", net1)
    # tf.summary.histogram("net2", net2)
    Ew = tf.sqrt(tf.reduce_sum(tf.square(net1 - net2), 1))  #我可以把它理解为计算结果么?
    tf.summary.histogram("Ew", Ew)
    L1 = 2 * (1 - y_) * tf.square(Ew) / Q
    L2 = 2 * y_ * tf.exp(-2.77 * Ew / Q) * Q
    tf.summary.histogram("L1", L1)
    tf.summary.histogram("L2", L2)
    Loss = tf.reduce_mean(L1 + L2)
    tf.summary.scalar("loss",Loss)

    prediction = tf.greater(Ew, thresh)
    tf.summary.histogram("prediction", tf.cast(prediction,tf.int32))
    # 定义准确率
    correct_prediction = tf.equal(prediction, tf.cast(y_, tf.bool))
    accuracy = tf.reduce_mean(tf.cast(correct_prediction, tf.float32))
    tf.summary.scalar("accuracy", accuracy)

    # 采用Adam作为优化器
    train_step = tf.train.GradientDescentOptimizer(lr).minimize(Loss)

    test_images = mnist.test.images
    test_labels = mnist.test.labels
    test_data,_,_ = pre_data(test_images,test_labels,9000)

    image_x = []
    image_y_acc = []
    image_y_loss = []

    with tf.Session() as sess:
        sess.run(tf.global_variables_initializer())
        # tf.summary.image("input", lenet.x, 3)
        merged_summary = tf.summary.merge_all()
        writer = tf.summary.FileWriter("LOGDIR/", sess.graph)  # 保存到不同的路径下

        for i in range(iterations):
            images,labels = mnist.train.next_batch(batch_size)
            data,_,_ = pre_data(images,labels,batch_size)
            sess.run(train_step,feed_dict={x1:data[0],x2:data[1],y:data[2]})
            if i%10 == 0:
                loss,acc,s = sess.run([Loss,accuracy,merged_summary],feed_dict={x1:test_data[0],x2:test_data[1],y:test_data[2]})
                writer.add_summary(s, i)
                print("%5d: accuracy is: %4f , loss is : %4f 。" % (i, acc, loss))
                image_x.append(i)
                image_y_acc.append(acc)
                image_y_loss.append(loss)
        e_w = sess.run(Ew, feed_dict={x1:test_data[0],x2:test_data[1],y:test_data[2]})

        threshs = [0.2, 0.5, 0.7 ,1., 1.3, 1.5, 1.8, 2.0, 2.5, 3.0, 3.5, 4.0, 4.5,5.0]
        for thresh in threshs:
            predictions = (e_w > thresh).astype(np.int8)
            labels = sess.run(y, feed_dict={y:test_data[2]})
            precision, recall, th = metrics.precision_recall_curve(labels, predictions)
            plt.plot(precision, recall, linewidth=1.0,label='thresh='+str(thresh))
        plt.plot([0.5,1], [0.5,1], linewidth=1.0,label='equal')
        plt.title("precision and recall curve")
        plt.legend()
        plt.xlabel("precision")
        plt.ylabel('recall')
        plt.show()
        print( '[accuracy,loss]:', sess.run([accuracy,Loss],feed_dict={x1:test_data[0],x2:test_data[1],y:test_data[2]}))

if __name__ =="__main__":
    model()
脚本
from mnist import *

if __name__ =="__main__":
    size = 9000
    test_images = mnist.test.images
    test_labels = mnist.test.labels
    test_data,count_right,count_nega = pre_data(test_images, test_labels, size)
    num_each_right = int(size / 2 / 10)  # 每个数字创造的样本数
    num_each_nega = int(size / 2 / 45)
    print "正例:",count_right
    print "正例的总样本数为",len(count_right)*num_each_right
    print "反例:",count_nega
    print "正例的总样本数为", len(count_nega) * num_each_nega
    print "测试集长度为:", len(test_data[0])

