python 时间序列预测——NARX循环神经网络
数据集
英国千年宏观经济数据集,UK_Economic ( ≃ \simeq ≃ 30M).

数据下载
import urllib.request as request

url ="https://www.bankofengland.co.uk/-/media/boe/files/statistics/research-datasets/a-millennium-of-macroeconomic-data-for-the-uk.xlsx"
loc = "UK_Economic.xlsx"
request . urlretrieve (url , loc)

Excel_file = pd.ExcelFile(loc)
print(Excel_file.sheet_names)
'''
['Disclaimer', "What's new in V3.1", 'Front page', 'A1. Headline series', 'BEG Table of contents', 'A2. Pop of Eng & GB 1086-1870', 'A3. Eng. Agriculture 1270-1870', 'A4. Ind Production 1270-1870', 'A5. Service Sector 1270-1870', 'A6. English GDP(O) 1270-1700', 'A7. GB GDP(O) 1700-1870', 'Notes on GDP estimates', 'A8. UK Real GDP(A)', 'A9. Nominal GDP (A)', 'A10. GNP and National Saving', 'A11. GDP(E) components - values', 'A12. GDP(E) components - vols', 'A13. GDP(E) contributions', 'A14. Real GDP(O) components', 'A15. Factor incomes by SIC ', 'A16. Industry GVA shares by SIC', 'A17. GDP(I) components', 'A18. Population 1680+', 'A19a. UK Migration flows', 'A19b. GB and Irish Migration', 'A19c. English Net Migration', 'A20. Migration by citizenship', 'A21. GDP per capita 1086+', 'A22. Coin in circulation', "A23. Bank of England B'Sheet", 'A24. Monetary aggregates', 'A25. Credit aggregates', 'A25a. Bills of Exchange', 'A26. Central govt 1290-1689', 'A27. Central govt borrowing ', 'A28. Public Sector Borrowing', 'A28a. Public Sector Spending', 'A29. The National Debt', 'A30a. Nat Debt mkt vals 1727', 'A30b. Nat Debt mkt vals 1900-', 'A30c. Term Annuities 1694-1836', 'A31. Interest rates & asset ps ', 'A32. Property prices & rent', 'A33. Exchange rate data', 'A34a. Export volumes 1280-1700', 'A34b. Import volumes 1560-1700', 'A34c. Off. trade values 1697-', 'A35. Trade volumes and prices', 'A36. Trade values and BOP', 'A37a. Trade breakdown 1560-1640', 'A37b. Trade breakdown 1663-1701', 'A38. Trade breakdown 1699-1774', 'A39. Trade - Goods trade 1784+', 'A40. Trade by region 1710-1822', 'A41. Trade by region 1784+', 'A42. Regional Trade summary', 'A43. Trade - by Trade Area', 'A44. Trade by Country', 'A45. UK Shares of world trade', 'A46. Net external assets', 'A47. Wages and prices', 'A48. Real Earnings ', 'A49. GB Employment in C18th', 'A50. Employment & unemployment', 'A51. Public Sector Employment', 'A52a. Wages, Salaries and Comp', 'A52b. Other labour statistics', 'A53. Employment by industry', 'A54. Hours worked', 'A55. Capital Stock', 'A56. Productivity', 'A57. Household saving', 'A58. BoE FoF 1952+', 'A59. FoF pre-ESA95', 'A60. FoF pre-ESA95 by inst', 'A61. Financial accounts ESA10', 'A62. Financial claims 1900-48', 'A63. Solomou and Weale', 'A64a. Sector balance sheets 57+', 'A64b. Sector Balance Sheets', 'A65. Personal Sector Wealth', 'A66. Balance sheets ESA10', 'Q1. Qrtly headline series', 'Q2. Qtly GDP 1920+', 'Q3. Qrtly money aggs 1870-2014 ', 'Q4. Corp borr. rates 1977+', 'Q5. Qrtly ERI indices 1920-38', 'Q6. Qrtly labour market Qs', 'Q7. Qrtly inflation expectation', 'M1. Mthly headline series', 'M2. Monthly activity 1846+', "M3. M'thly  GDP 1920-1938", 'M4. Monthly IP 1920+', 'M5. Administrative unemp 1881+', 'M6. Mthly prices and wages', 'M7. Mthly money aggs 1870-', 'M8. Mthly credit aggs 1921+', 'M9. Mthly short-term rates', 'M10. Mthly long-term rates', 'M11. Mthly corp bond yields', 'M12. Mthly HH loan rates 1939+', 'M13. Mthly share prices 1709+ ', 'M14. Mthly Exchange rates 1963+', 'M15. Mthly $-£ 1791-2015', 'W1. Issue Department', 'W2. Banking Department', 'D1. Official Interest Rates', 'D2. Bilaterals', 'D3. ERI vintages']
'''
预测对象(输出) 和 影响因素(输入)
spreadsheet = Excel_file.parse ('A1. Headline series')
print(spreadsheet . iloc [201 ,0])
print(spreadsheet . iloc [361 ,0])

unemployment = spreadsheet .iloc [792:938 ,27]
inflation = spreadsheet . iloc [792:938 ,41]
bank_rate = spreadsheet . iloc [792:938 ,44]
debt = spreadsheet . iloc [792:938 ,73]
GDP_trend = spreadsheet . iloc [792:938 ,2]

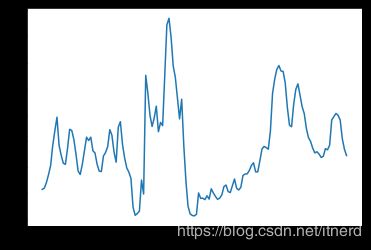
plt.plot(unemployment)
plt.show()
预测对象:失业率
plt.figure(figsize=(10,10))
plt.subplot(2,2,1)
plt.plot(inflation)
plt.title('inflation')
plt.subplot(2,2,2)
plt.plot(bank_rate)
plt.title('bank rate')
plt.subplot(2,2,3)
plt.plot(debt)
plt.title('debt')
plt.subplot(2,2,4)
plt.plot(GDP_trend)
plt.title('GDP trend')
输入变量
将数据另存
x= pd. concat ([ GDP_trend ,debt , bank_rate ,inflation ], axis =1)
x.columns = [" GDP_trend "," debt "," bank_rate "," inflation "]
x = x.astype(np.float)

y = pd. to_numeric(unemployment)
loc = "economic_x.csv"
x.to_csv ( loc )
loc = "economic_y.csv"
y.to_csv ( loc )
NARX
数据读取
loc = "economic_x.csv"
x = pd. read_csv (loc)
x= x.drop( x.columns [[0]] , axis =1)
loc = "economic_y.csv"
y = pd.read_csv (loc , header = None )
y= y.drop( y. columns [[0]] , axis =1)

scaler_x = preprocessing . MinMaxScaler (feature_range =(0 , 1))
x = np. array (x). reshape (( len(x) ,4 ))
x = scaler_x . fit_transform (x)
scaler_y = preprocessing . MinMaxScaler (feature_range =(0 , 1))
y = np. array (y). reshape (( len(y), 1))
y = scaler_y . fit_transform (y)
y=y. tolist ()
x=x. tolist ()
模型训练
from pyneurgen.neuralnet import NeuralNet
from pyneurgen.recurrent import NARXRecurrent

random . seed (2016)
input_nodes = 4
hidden_nodes = 10
output_nodes = 1
output_order = 1
input_order = 3
incoming_weight_from_output = 0.1
incoming_weight_from_input = 0.8

model = NeuralNet ()
model . init_layers ( input_nodes ,
                    [ hidden_nodes],
                    output_nodes ,
                    NARXRecurrent (output_order ,
                                    incoming_weight_from_output ,
                                    input_order ,
                                    incoming_weight_from_input )
                   )
model . randomize_network ()
model . layers[1]. set_activation_type ('sigmoid')
model . set_learnrate (0.35)
model . set_all_inputs (x)
model . set_all_targets (y)

length = len(x)
learn_end_point = int( length * 0.85)
model .set_learn_range (0, learn_end_point )
model .set_test_range (learn_end_point + 1,length -1)

model .learn(epochs =100 ,show_epoch_results =True ,random_testing = False )

mse = model. test ()
print(" MSE for test set = ",round(mse ,6))

target = np.array([ item [0][0] for item in fit1.test_targets_activations ])
pred = [ item [1][0] for item in fit1.test_targets_activations ]
# pred1 = scaler_y.inverse_transform (np.array( pred ). reshape((len(pred), 1)))

plt.plot(target)
plt.plot(pred)
plt.plot(target*1.05,'--g',target*0.95,'--g')
plt.legend(['target','prediction','CI'])


