Python实现卡尔曼滤波器
对一列数作为观察值进行卡尔曼滤波测试,预测值序列的方差自行设置。
import numpy as np
import pylab
import get_d

sz = 15  # 数组长度
ob_list = [56, 79, 78, 78, 80, 79, 80, 78, 78, 79, 82, 75, 80, 76, 77]  # 观察值列表
Q = 2  # (模型预测均方误差) 误差越大,滤波曲线越贴近观察值;反之贴近模型预测值

x_pst = np.zeros(sz)
err_pst = np.zeros(sz)
x_pri = np.zeros(sz)
err_pri = np.zeros(sz)
K = np.zeros(sz)

D = get_d.get_D(ob_list)  # 观察值均方误差
x_pst[0] = 77
err_pst[0] = 0

for cnt in range(1, sz):
    x_pri[cnt] = x_pst[cnt - 1]
    err_pri[cnt] = err_pst[cnt - 1] + Q

    K[cnt] = err_pri[cnt] / (err_pri[cnt] + D)
    x_pst[cnt] = x_pri[cnt] + K[cnt] * (ob_list[cnt] - x_pri[cnt])
    err_pst[cnt] = (1 - K[cnt]) * err_pri[cnt]

pylab.figure()
pylab.axis([0, 15, 50, 90])
pylab.plot(ob_list, color='r', label='Actual')
pylab.plot(x_pst, color='b', label='Estimation')
pylab.legend()
pylab.show()
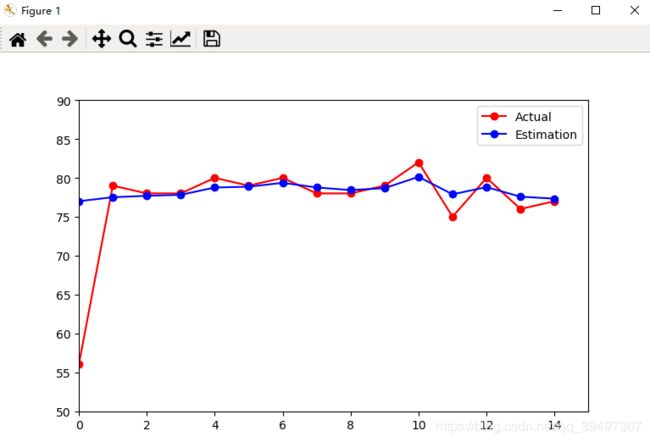
运行结果图:

可见预测曲线相比观察值曲线平滑。
附均方差计算函数:get_d.py
import numpy as np


def get_D(ob_list):
    sz = len(ob_list)
    s = 0
    for i in range(0, sz):
        s = s + ob_list[i]
    avg = s / sz
    s1 = 0
    for i in range(0, sz):
        s1 = s1 + (ob_list[i] - avg) ** 2
    s2 = np.sqrt(s1 / sz)
    return s2