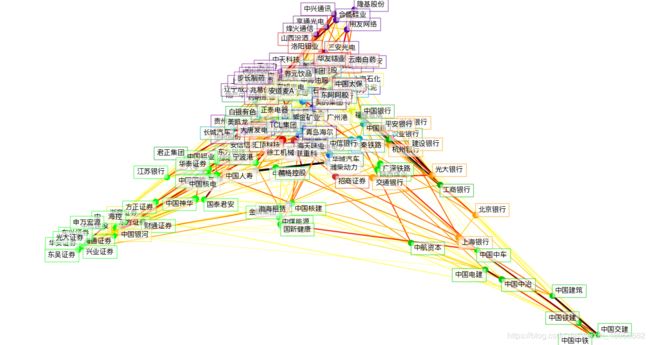
从tushare中提取股票交易数据并进行聚类分析
沪深300指的聚类分析显示福耀玻璃竟然和银行股在同一类,还是蛮惊讶的。
本文是从tushare上提的数据,参与聚类分析股票为295个。
结果如下,代码附后面。
结果:
Cluster 1: 中金黄金, 山东黄金
Cluster 2: 亨通光电, 烽火通信, 中天科技, 辽宁成大, 伊利股份, 春秋航空, 兆易创新, 中兴通讯
Cluster 3: 贵州茅台, 天士力, 济川药业, 通化东宝, 上海医药, 药明康德, 步长制药
Cluster 4: 恒生电子, 用友网络, 三安光电, 隆基股份, 中国平安, 养元饮品, 合盛硅业
Cluster 5: 川投能源, 国投电力, 长江电力
Cluster 6: 海螺水泥, 青岛海尔, 九州通, 美的集团
Cluster 7: 华域汽车
Cluster 8: 中国电影
Cluster 9: 大秦铁路
Cluster 10: 厦门钨业, 航发动力, 南京银行, 新华保险, 长城汽车, 正泰电器, 中国重工, 贵阳银行, 中信银行, 欧派家居, TCL集团
Cluster 11: 新城控股
Cluster 12: 方大炭素, 物产中大, 白银有色, 君正集团, 美凯龙
Cluster 13: 农业银行, 工商银行, 中国银行
Cluster 14: 中航资本, 中国铁建, 中国中铁, 中国中冶, 中国建筑, 中国电建, 中国交建
Cluster 15: 陕西煤业, 广深铁路, 中国中车, 藏格控股, 国新健康
Cluster 16: 东方明珠, 国电电力, 海通证券, 华安证券, 江苏银行, 东方证券, 宁波港, 中国神华, 财通证券, 东兴证券, 国泰君安, 兴业证券, 东吴证券, 中国铝业, 中国核建, 华泰证券, 上海电气, 光大证券, 中国国旅, 中煤能源, 方正证券, 中远海控, 金隅集团, 申万宏源
Cluster 17: 海油工程, 中国国航, 中海油服, 东旭光电
Cluster 18: 福耀玻璃, 上海石化, 成都银行, 中国石油, 紫金矿业, 安道麦A
Cluster 19: 安信信托, 中信建投, 浙商证券, 中国银河
Cluster 20: 永辉超市
Cluster 21: 杭州银行, 兴业银行, 北京银行, 上海银行, 交通银行, 光大银行, 建设银行, 平安银行
Cluster 22: 大唐发电
Cluster 23: 汇顶科技
Cluster 24: 康美药业, 中航沈飞, 山西汾酒, 工业富联, 中国太保, 华友钴业, 洛阳钼业
Cluster 25: 绿地控股, 招商证券, 广汽集团, 海天味业, 东阿阿胶, 云南白药
Cluster 26: 中国化学, 广州港, 三六零, 中国人寿, 中国核电, 中联重科, 潍柴动力, 渤海租赁, 徐工机械
(Lec3-2)
import numpy as np
import pandas as pd
import tushare as ts
import MySQLdb as mdb
import matplotlib
matplotlib.use(“TkAgg”)
import matplotlib.pyplot as plt
from matplotlib.collections import LineCollection
import pandas as pd
from sklearn import cluster,covariance,manifold
from matplotlib.font_manager import FontProperties
#获取沪深300指数的股票名单
hs300_data=ts.get_hs300s()
#hss=hs300_data[“name”]
#获取上交所SSE,深交所SZSE,港交所HKEX正常上市交易的股票名单
pro=ts.pro_api()
exc=[“SSE”,“SZSE”]
stock_data=[]
for ex in exc:
data=pro.query(‘stock_basic’, exchange=ex,
list_status=‘L’,
fields=‘ts_code,symbol,name,area,industry,list_date’)
stock_data.append(data)
#获取沪深300成分股中正常上市交易的名单
#将stock_data中上交所和深交所中的交易数据合并
s_name=pd.concat([stock_data[0][[“name”,“ts_code”]],
stock_data[1][[“name”,“ts_code”]]],ignore_index=True)
#找出沪深300指在上交所和深交所的交易代码
hs300_data=hs300_data.set_index(“name”)
s_name=s_name.set_index(“name”)
sdata=pd.merge(hs300_data,s_name,on=“name”,how=“inner”)
ts_code=sdata[“ts_code”].values
n=len(ts_code)
#提取沪深300指2010年01月01到2018年01月01的交易数据,存入d_price中
d_price=[]
names=[]
symbols=[]
for i in range(62,199):
df = pro.daily(ts_code=ts_code[i],
start_date=‘20181201’,
end_date=‘20190101’)
d_price.append(df)
names.append(sdata[sdata[“ts_code”]==ts_code[i]].index.tolist())
symbols.append(ts_code[i])
names=pd.DataFrame(names)
symbols=pd.DataFrame(symbols)
op=[]
cl=[]
for q in d_price:
op.append(q[‘open’].values)
cl.append(q[‘close’].values)
close_prices=np.vstack([i for i in op])
open_prices=np.vstack([j for j in cl])
The daily variations of the quotes are what carry most information
variation = close_prices - open_prices
Learn a graphical structure from the correlations
edge_model = covariance.GraphicalLassoCV(cv=5)
standardize the time series: using correlations rather than covariance
is more efficient for structure recovery
X = variation.copy().T
X /= X.std(axis=0)
edge_model.fit(X)
Cluster using affinity propagation
, labels = cluster.affinity_propagation(edge_model.covariance)
n_labels = labels.max()
for i in range(n_labels + 1):
print(‘Cluster %i: %s’ % ((i + 1), ', '.join(names[0][labels == i])))
Find a low-dimension embedding for visualization: find the best position of
the nodes (the stocks) on a 2D plane
We use a dense eigen_solver to achieve reproducibility (arpack is
initiated with random vectors that we don’t control). In addition, we
use a large number of neighbors to capture the large-scale structure.
node_position_model = manifold.LocallyLinearEmbedding(
n_components=2, eigen_solver=‘dense’, n_neighbors=6)
embedding = node_position_model.fit_transform(X.T).T
Visualization
plt.figure(1, facecolor=‘w’, figsize=(10, 8))
plt.clf()
ax = plt.axes([0., 0., 1., 1.])
plt.axis(‘off’)
Display a graph of the partial correlations
partial_correlations = edge_model.precision_.copy()
d = 1 / np.sqrt(np.diag(partial_correlations))
partial_correlations *= d
partial_correlations *= d[:, np.newaxis]
non_zero = (np.abs(np.triu(partial_correlations, k=1)) > 0.02) #np.triu返回上角矩阵
Plot the nodes using the coordinates of our embedding
#x=embedding[0],y=embedding[1],画出代表股票的点
plt.scatter(embedding[0], embedding[1], s=100 * d ** 2, c=labels,
cmap=plt.cm.nipy_spectral)
Plot the edges
start_idx, end_idx = np.where(non_zero)#以元组形式返回值为true的坐标
a sequence of (line0, line1, line2), where::
linen = (x0, y0), (x1, y1), … (xm, ym)
segments = [[embedding[:, start], embedding[:, stop]]
for start, stop in zip(start_idx, end_idx)]
values = np.abs(partial_correlations[non_zero]) #行列式子变换后的矩阵的非零值
lc = LineCollection(segments,
zorder=0, cmap=plt.cm.hot_r,
norm=plt.Normalize(0, .7 * values.max()))
lc.set_array(values)
lc.set_linewidths(10 * values)
ax.add_collection(lc)
Add a label to each node. The challenge here is that we want to
position the labels to avoid overlap with other labels
#x,y为表示股票坐标的点的坐标
for index, (name, label, (x, y)) in enumerate(
zip(names[0], labels, embedding.T)):
dx = x - embedding[0] #某一个点的横坐标于其他所有点的横坐标的差值,长度为56
dx[index] = 1 #设第index个值为1,原值为0
dy = y - embedding[1]#某一个点的纵坐标于其他所有点的纵坐标的差值,长度为56
dy[index] = 1#设第index个值为1,原值为0
this_dx = dx[np.argmin(np.abs(dx))]
#np.argmin()返回最小值所在的下标,本语句为求出dx绝对值最小值所在的dx坐标
this_dy = dy[np.argmin(np.abs(dy))]
#np.argmin()返回最小值所在的下标,本语句为求出dy绝对值最小值所在的dx坐标
if this_dx > 0:
    horizontalalignment = 'left'
    x = x + .002
else:
    horizontalalignment = 'right'
    x = x - .002
if this_dy > 0:
    verticalalignment = 'bottom'
    y = y + .002
else:
    verticalalignment = 'top'
    y = y - .002
plt.text(x, y, name, size=10,
         horizontalalignment=horizontalalignment,
         verticalalignment=verticalalignment,
         bbox=dict(facecolor='w',
                   edgecolor=plt.cm.nipy_spectral(label / float(n_labels)),
                   alpha=.6),fontproperties=FontProperties(fname='/System/Library/Fonts/PingFang.ttc'))
plt.xlim(embedding[0].min() - .15 * embedding[0].ptp(),
embedding[0].max() + .10 * embedding[0].ptp())
plt.ylim(embedding[1].min() - .03 * embedding[1].ptp(),
embedding[1].max() + .03 * embedding[1].ptp())
plt.show()
可以用我的邀请链接注册tushare:https://tushare.pro/register?reg=231221