dataframe切片
print(business.columns)
df2.iloc[:,1:]
df[3:5]
df.iloc[3:5,0:2]
df.loc[:,['A','B']]
df.iat[1,1]
注:loc是指location的意思,iloc中的i是指integer
loc works on labels in the index.(即标签索引)
iloc works on the positions in the index (so it only takes integers). (位置索引,只能是数字)
筛选
df[(df.num > 0) & (df.year > 2016)]
df[['date','id']][(df.num > 0) & (df.year > 2016)]
list=['2017','2019','2009']
df['year'].isin(list)
df[df['year'].isin(list)]
实现行列计算
df['列求和'] = df.apply(lambda x: x.sum(), axis=1)
df.loc['行求和'] = df.apply(lambda x: x.sum())
df['列累积和'] = df['某一列'].cumsum()
df.sum()
df.sum(1)
cov_user = d_user.cov()
cov_user.style.background_gradient(cmap='coolwarm').set_precision(2)
corr_user = d_user.corr()
corr_user.style.background_gradient(cmap='coolwarm').set_precision(2)
预处理
newDf = pd.DataFrame(df, columns=[column1, column2, column3])
"".join(df['x'])
df['new'] = df['x']+df['y']+df['z']
newb = pd.DataFrame(b_reduced, columns=['c', 'a', 's'])
u17 = u17.dropna(subset=["funny", "fans"])
df[['two', 'three']] = df[['two', 'three']].astype(float)
Series.str.contains(self, pat, case=True, flags=0, na=nan, regex=True)
groupby
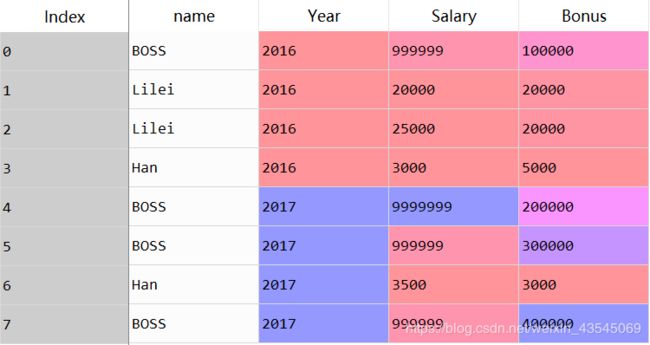
salaries=pd.DataFrame({
'name':['BOSS','Lilei','Lilei','Han','BOSS','BOSS','Han','BOSS'],
'Year':[2016,2016,2016,2016,2017,2017,2017,2017],
'Salary':[999999,20000,25000,3000,9999999,999999,3500,999999],
'Bonus':[100000,20000,20000,5000,200000,300000,3000,400000] })
python
group_by_name=salaries.groupby('name')
print(type(group_by_name))
for name,group in group_by_name:
print(name)
print(group)
print(group_by_name[['Year','Bonus']].count())
group_by_name[['Salary','Bonus']].agg(sum)
group_by_name.get_group('Lilei')
print(group_by_name[['Bonus','Salary']].agg(['count','mean','std']))
t0 = group_by_name[['Bonus','Salary']].agg(['count','mean','std'])
sns.relplot(data=t0.iloc[:,0],kind='line')
sns.barplot(x="name", y="Bonus", hue="Year", data=salaries)
plt.plot(x=t0.index, y=t0.iloc[:,0], c = 'y')
t0.iloc[:,[0,1,2]]
plt.grid(linestyle='-.')
t0.plot(y=[1,4],label = ["test",'ou'])
plt.show()
salaries.iloc[:,[0,1]]
group_by_name_year=salaries.groupby(['name','Year'])
print(group_by_name_year.count())
group_by_name_year.groups
datetime日期
import time
now = time.strftime("%Y-%m-%d %H:%M:%S")
today = dt.datetime.today()
z['date'].dt.time