octave的环境配置及简单使用
文章目录
- 为什么是Octave
- Octave环境配置
- Octave安装与测试
- Octavet添加扩展包
- Octave的简单使用
- 矩阵定义和运算
- 文件操作
- 数据可视化
- 参考资料
为什么是Octave
最近在看Andrew Ng的机器学习课程,其中大佬介绍了一个软件,叫做Octave,目前多用于机器学习的程序编写,相比于其他软件和语言更加简洁容易。
虽然说是Ng大佬鼎力推荐,但是我们也要首先明白,Octave是什么,我们为什么要用Octave:Octave是一种编程语言,旨在解决数值计算和统计学习问题。其语法与Matlab语法非常接近,可以很容易的将matlab程序移植到Octave,同时与C++等语言接口较Matlab更加方便。总而言之,Octave就是一款在数值计算和处理方面更简介,功能强大的编程语言,所以不妨一试,下面就开始愉快的安装之旅。
Octave环境配置
Octave安装与测试
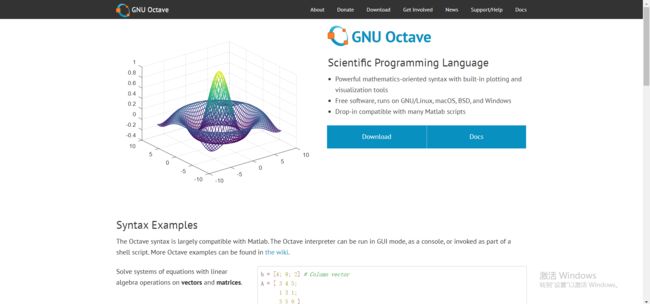
首先进入官网:https://www.gnu.org/software/octave/,然后进入下载界面,选择合适的版本下载:
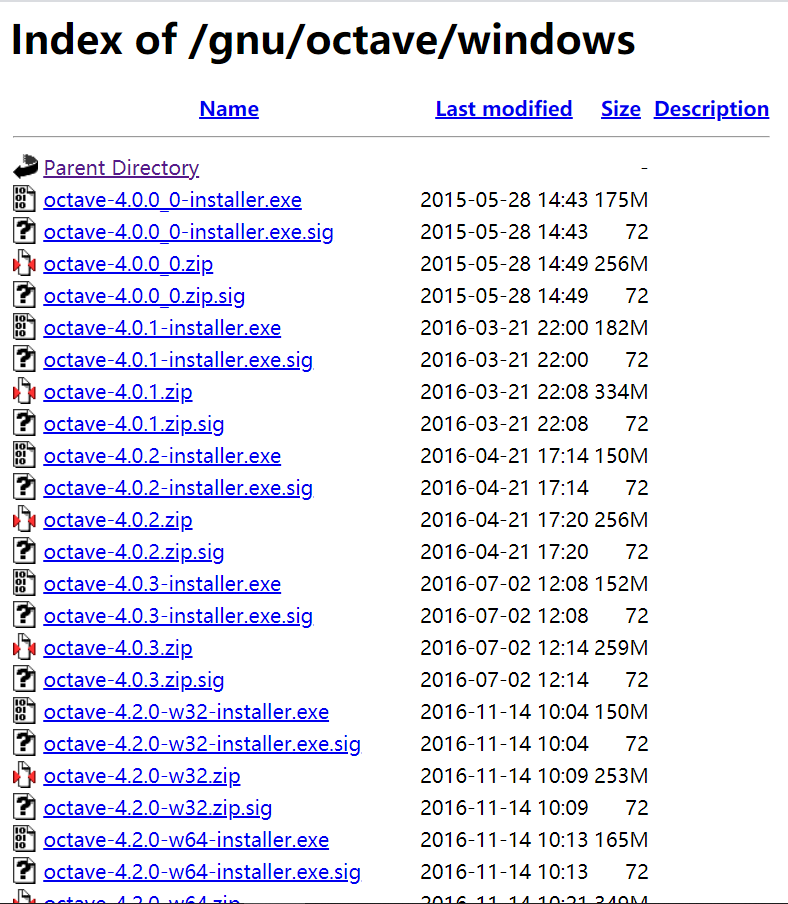
windows的下载网址如下:https://ftp.gnu.org/gnu/octave/windows/ 选择自己需要的版本下载即可,注意系统是32位还是64位,我下载的是octave-5.2.0_1-w64-installer.exe。
然后运行安装程序,按照步骤进行就好了,这里就很简单了,其实是忘记截图了(误,划掉)。
安装完成后,桌面上会出现两个快捷方式:
其中CLI的是命令行模式,GUI是图形交互界面模式。当然我更多时候还是喜欢图形界面,毕竟会直观一点。
打开GUI,输入一个简单的乘法运算测试一下软件:
安装成功并可以使用。
Octavet添加扩展包
而我们要使用一个扩展包时,首先可以看看自己的库里有没有这个包,在命令行输入:
pkg list
发现下载时就带的包还是不少的:
Package Name         | Version | Installation directory
---------------------+---------+-----------------------
              audio  |   2.0.0 | ...\Octave-5.2.0\mingw64\share\octave\packages\audio-2.0.0
     communications  |   1.2.2 | ...\mingw64\share\octave\packages\communications-1.2.2
            control  |   3.2.0 | ...\mingw64\share\octave\packages\control-3.2.0
     data-smoothing  |   1.3.0 | ...\mingw64\share\octave\packages\data-smoothing-1.3.0
           database  |   2.4.4 | ...\mingw64\share\octave\packages\database-2.4.4
          dataframe  |   1.2.0 | ...\mingw64\share\octave\packages\dataframe-1.2.0
              dicom  |   0.2.2 | ...\Octave-5.2.0\mingw64\share\octave\packages\dicom-0.2.2
          financial  |   0.5.3 | ...\mingw64\share\octave\packages\financial-0.5.3
               fits  |   1.0.7 | ...\Octave-5.2.0\mingw64\share\octave\packages\fits-1.0.7
fuzzy-logic-toolkit  |   0.4.5 | ...\mingw64\share\octave\packages\fuzzy-logic-toolkit-0.4.5
                 ga  |  0.10.1 | ...\Octave-5.2.0\mingw64\share\octave\packages\ga-0.10.1
            general  |   2.1.0 | ...\mingw64\share\octave\packages\general-2.1.0
      generate_html  |   0.3.1 | ...\mingw64\share\octave\packages\generate_html-0.3.1
           geometry  |   3.0.0 | ...\mingw64\share\octave\packages\geometry-3.0.0
                gsl  |   2.1.1 | ...\Octave-5.2.0\mingw64\share\octave\packages\gsl-2.1.1
              image  |  2.10.0 | ...\Octave-5.2.0\mingw64\share\octave\packages\image-2.10.0
 instrument-control  |   0.4.0 | ...\mingw64\share\octave\packages\instrument-control-0.4.0
           interval  |   3.2.0 | ...\mingw64\share\octave\packages\interval-3.2.0
                 io  |  2.4.13 | ...\Octave-5.2.0\mingw64\share\octave\packages\io-2.4.13
     linear-algebra  |   2.2.3 | ...\mingw64\share\octave\packages\linear-algebra-2.2.3
               lssa  |   0.1.3 | ...\Octave-5.2.0\mingw64\share\octave\packages\lssa-0.1.3
              ltfat  |   2.3.1 | ...\Octave-5.2.0\mingw64\share\octave\packages\ltfat-2.3.1
            mapping  |   1.2.1 | ...\mingw64\share\octave\packages\mapping-1.2.1
      miscellaneous  |   1.3.0 | ...\mingw64\share\octave\packages\miscellaneous-1.3.0
                nan  |   3.4.5 | ...\Octave-5.2.0\mingw64\share\octave\packages\nan-3.4.5
             netcdf  |  1.0.12 | ...\mingw64\share\octave\packages\netcdf-1.0.12
              nurbs  |  1.3.13 | ...\Octave-5.2.0\mingw64\share\octave\packages\nurbs-1.3.13
                ocs  |   0.1.5 | ...\Octave-5.2.0\mingw64\share\octave\packages\ocs-0.1.5
             odepkg  |   0.8.5 | ...\Octave-5.2.0\mingw64\share\octave\packages\odepkg-0.8.5
              optim  |   1.6.0 | ...\Octave-5.2.0\mingw64\share\octave\packages\optim-1.6.0
        optiminterp  |   0.3.5 | ...\mingw64\share\octave\packages\optiminterp-0.3.5
         quaternion  |   2.4.0 | ...\mingw64\share\octave\packages\quaternion-2.4.0
           queueing  |   1.2.6 | ...\mingw64\share\octave\packages\queueing-1.2.6
             signal  |   1.4.1 | ...\Octave-5.2.0\mingw64\share\octave\packages\signal-1.4.1
            sockets  |   1.2.0 | ...\mingw64\share\octave\packages\sockets-1.2.0
          sparsersb  |   1.0.6 | ...\mingw64\share\octave\packages\sparsersb-1.0.6
            specfun  |   1.1.0 | ...\mingw64\share\octave\packages\specfun-1.1.0
            splines  |   1.3.3 | ...\mingw64\share\octave\packages\splines-1.3.3
         statistics  |   1.4.1 | ...\mingw64\share\octave\packages\statistics-1.4.1
                stk  |   2.6.1 | ...\Octave-5.2.0\mingw64\share\octave\packages\stk-2.6.1
            strings  |   1.2.0 | ...\mingw64\share\octave\packages\strings-1.2.0
             struct  |  1.0.16 | ...\mingw64\share\octave\packages\struct-1.0.16
             tisean  |   0.2.3 | ...\Octave-5.2.0\mingw64\share\octave\packages\tisean-0.2.3
                tsa  |   4.6.2 | ...\Octave-5.2.0\mingw64\share\octave\packages\tsa-4.6.2
              video  |   1.2.4 | ...\Octave-5.2.0\mingw64\share\octave\packages\video-1.2.4
            windows  |   1.4.0 | ...\mingw64\share\octave\packages\windows-1.4.0
             zeromq  |   1.5.0 | ...\Octave-5.2.0\mingw64\share\octave\packages\zeromq-1.5.0
有两种方法更新扩展包,第一种是在线自动更新,以image包为例直接输入命令:
pkg install -forge image
但是我在使用时一直出现了如下的报错:
error: get_forge_pkg: could not read URL, please verify internet connection
error: called from
    get_forge_pkg at line 66 column 7
    get_forge_download at line 26 column 14
    pkg at line 407 column 31
查询过有关资料发现,windows系统中pkg在线更新的与ftp的链接似乎存在一些问题,而且目前也没有什么好的解决方法,所以我们只能采取第二种更新方式,下载安装包并且手动更新。
登陆官网,我们可以发现,octave提供了许多可用的,功能强大的扩展包:https://octave.sourceforge.io/packages.php。我们可以选择更新和下载新的包:
我们以image包为例,我们可以看到image包官方版本已经给到了2.12.0,而我的Octave还只有2.10.0:
直接点击download下载即可。
下载完成后,在GUI界面的文件资源管理器中打开下载的包所在的文件夹:
然后在命令行输入命令:
pkg install image-2.12.0.tar.gz
安装之后我的GUI界面卡死了,于是不得已强行退出了界面,不过重新打开界面再list扩展包时,发现image版本已经变成2.12.0了,说明应该是安装成功了,于是我们进行进一步测试。
我们可以尝试载入一下这个包,输入命令:
pkg load image
再输入命令:
help image
显示关于这个报的用法,如果正常显示,则说明安装/更新成功:
'image' is a function from the file D:\Software\Octave-5.2.0\mingw64\share\octave\5.2.0\m\image\image.m

 -- image (IMG)
 -- image (X, Y, IMG)
 -- image (..., "PROP", VAL, ...)
 -- image ("PROP1", VAL1, ...)
 -- H = image (...)
     Display a matrix as an indexed color image.

     The elements of IMG are indices into the current colormap.

     X and Y are optional 2-element vectors, '[min, max]', which specify
     the coordinates of the centers of the corner pixels.  If a range is
     specified as '[max, min]' then the image will be reversed along
     that axis.  For convenience, X and Y may be specified as N-element
     vectors matching the length of the data in IMG.  However, only the
     first and last elements will be used to determine the axis limits.

     Multiple property/value pairs may be specified for the image
     object, but they must appear in pairs.

     The optional return value H is a graphics handle to the image.

     Implementation Note: The origin (0, 0) for images is located in the
     upper left.  For ordinary plots, the origin is located in the lower
     left.  Octave handles this inversion by plotting the data normally,
     and then reversing the direction of the y-axis by setting the
     'ydir' property to "reverse".  This has implications whenever an
     image and an ordinary plot need to be overlaid.  The recommended
     solution is to display the image and then plot the reversed ydata
     using, for example, 'flipud (ydata)'.

     Calling Forms: The 'image' function can be called in two forms:
     High-Level and Low-Level.  When invoked with normal options, the
     High-Level form is used which first calls 'newplot' to prepare the
     graphic figure and axes.  When the only inputs to 'image' are
     property/value pairs the Low-Level form is used which creates a new
     instance of an image object and inserts it in the current axes.

     Graphic Properties: The full list of properties is documented at
     *note Image Properties: Image Properties.

     See also: imshow, imagesc, colormap.

Additional help for built-in functions and operators is
available in the online version of the manual.  Use the command
'doc ' to search the manual index.

Help and information about Octave is also available on the WWW
at https://www.octave.org and via the [email protected]
mailing list.
更新成功,结束。
Octave的简单使用
矩阵定义和运算
>> A=[1 2;3 4;5 6] %定义一个矩阵
>> size(A) %求矩阵大小
>> B=[1 2 3 4] %定义一个向量
>> length(B) %求向量维度

>> who %显示当前所有变量名称
>> whos %显示当前变量名称和详细信息
>> A(3,2) %输出第三行第二列
>> A(2,:) %输出第二行所有的元素
>> A(:,2)=[10;11;13]  %修改第二列的所有值
>> A(:) %将A修改为一个列向量
>> C=[A B] %直接连接两个矩阵,A在左,B在右
>> C=[A;B] %直接连接两个矩阵,A在左上上,B在右下

%A,B都是矩阵
>> A*B %计算A 和B的乘积
%. 表示对每一个元素进行某种操作,例如:
>> 1 ./A %取A中每一个元素的倒数
>> log(A) %取A中的每一个元素的对数
>> exp(A) %取A中的每一个元素的自然指数
>> abs(A) %取A中的每一个元素的绝对值
>> -A %表示对A中的每一个元素取反
>> A+1 %表示A中的每一个元素加1
>> max(A) %表示求出A中的最大值。如果A是矩阵,求每一列最大值,如果A是向量,直接求最大值
>> find(A<3) %找出向量中小于3的数字
>> A<3 %返回的是01字符串,表示每个元素是否小于3
>> sum(A,1) %每一列所有元素的和
>> sum(A,2)  %每一行所有元素的和
>> sum(sum(A.*eye(9))) %求A的对角线之和
>> max(A,[],1) %返回一个行矩阵,是A中每一列的最大值
>> max(A,[],2) %返回一个列矩阵,是A中每一行的最大值
>> max(A) %求出每一列的最大值
>> max(max(A)) %求矩阵的最大值
>> A' %表示求A的转置
>> pinv(A) %求出A的逆矩阵

>> ones %创建全1矩阵
>> zero %创建全0矩阵
>> diag(1,2,3) %创建对角线是1,2,3,其他全部是0的矩阵
>> e=[] %创建一个空矩阵
>> eye(3) %创建一个3*3的单位矩阵
文件操作
>> cd 'c:\snow' %修改路径
>> load 1.dat %加载文件
>> save 1 %保存文件
>> save hello.mat variable %表示把某个变量存入到文件中
>> save hello.txt C -ascii %把文件储存为ascii码形式
数据可视化
>> t=[0:0.01:0.98];
>> y1=sin(8*pi*t);
>> y2=cos(8*pi*t);
>> plot(t,y1);
>> hold on;
>> plot(t,y2,'r');
>> xlabel('time');
>> ylabel('value');
>> title('my first plot');
>> legend('sin','cos');
>> cd 'D:\';print -dpng 'myPng';
>> close
>> clf
>> figure(1);plot(t,y1);
>> figure(2);plot(t,y2);
>> subplot(1,2,1)
>> plot(t,y2);
>> subplot(1,2,2);
>> plot(t,y1);
>> axis([0.5,1,-2,2])
>> print -dpng '2.png'
>> close
>> clf
参考资料
- octave官网:https://www.gnu.org/software/octave/
- 博客 Machine Learning-Octave的下载与安装:https://blog.csdn.net/Forlogen/article/details/54425766
- 博客 octave的安装及工具箱的使用:http://blog.sina.com.cn/s/blog_1358485f70102wmpa.html
- 博客 octave的安装与使用:https://blog.csdn.net/m0_37809075/article/details/83816837?ops_request_misc=%7B%22request%5Fid%22%3A%22159107017619195264531092%22%2C%22scm%22%3A%2220140713.130102334..%22%7D&request_id=159107017619195264531092&biz_id=0&utm_medium=distribute.pc_search_result.none-task-blog-2~blog~top_click~default-1-83816837.pc_v2_rank_blog_default&utm_term=octave](https://blog.csdn.net/m0_37809075/article/details/83816837?ops_request_misc={"request_id"%3A"159107017619195264531092"%2C"scm"%3A"20140713.130102334.."}&request_id=159107017619195264531092&biz_id=0&utm_medium=distribute.pc_search_result.none-task-blog-2~blog~top_click~default-1-83816837.pc_v2_rank_blog_default&utm_term=octave


