超级详细讲解线性回归(含吴恩达相关)
文章目录
- 什么是线性回归
- 从图像中理解线性回归
- 相关代码
- 一元线性回归
- 引入
- 一元线性回归公式
- 一元线性回归的目标
- 线性回归的流程
- 单个样本点分析
- 损失函数
- 梯度下降(Gradient Descent )
- 多个样本点
- 损失函数
- 梯度下降(Gradient Descent )
- 代码实现
- 训练模型函数
- 模型拟合函数
- 损失函数(代价函数)
- 梯度下降算法
- 迭代函数
- 画图显示
- 完整的代码
- 手写线性回归函数代码
- sklearn 线性回归函数代码
- 吴恩达机器学习线性回归案例
- 手写线性回归
- sklearn 线性回归函数代码
- 参考资料
- 本文章的相关代码与数据下载
什么是线性回归
直观上理解,就是有我们已经有一批数据集,然后我们要从这批数据中,找出自变量与因变量之间的关系,并用这个找到的关系,通过输入新的未知的数据自变量,来找到对应的因变量。
按自变量个数可分为一元线性回归分析方程和多元线性回归分析方程。
线性回归方程是利用数理统计中的回归分析,来确定两种或两种以上变数间相互依赖的定量关系的一种统计分析方法之一。线性回归也是回归分析中第一种经过严格研究并在实际应用中广泛使用的类型。按自变量个数可分为一元线性回归分析方程和多元线性回归分析方程。
线性回归是一种x和y之间的关系为线性关系的回归分析。y = a 1 x 1 + a 2 x 2 + b y={a_1}x_1+a_2x_2+b y=a1x1+a2x2+b
这个叫线性关系。如果这里出现了
x 2 , l o g ( x ) , s i n ( x ) x^2,log(x) ,sin(x) x2,log(x),sin(x)
之类的,那就不是线性关系了。
从图像中理解线性回归
-
效果
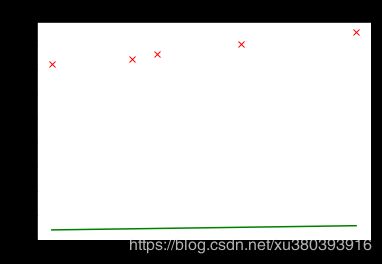
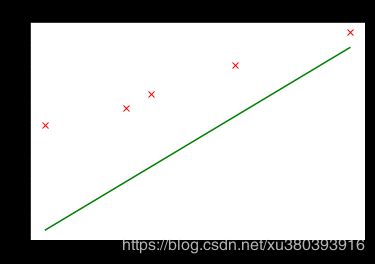
文字太多,我们来看一组图片(下图是一元的线性回归)
这个是粗略手动拟合的线性回归的效果,初步的感受一下线性回归的过程
相关代码
运行环境:jupyter
python3.6
- 说明:
pycharm 环境中,应该注释掉:
%matplotlib inline
以及
在 plt.plot(x, y, ‘rx’) 后面增加 plt.show()
- 原始数据散点图
%matplotlib inline
import numpy as np
import matplotlib.pyplot as plt

x = [13854,12213,11009,10655,9503] #程序员工资,顺序为北京,上海,杭州,深圳,广州
x = np.reshape(x,newshape=(5,1)) / 10000.0
y =  [21332, 20162, 19138, 18621, 18016] #算法工程师,顺序和上面一致
y = np.reshape(y,newshape=(5,1)) / 10000.0
print(x)
print(y)
plt.title("initial data")
plt.plot(x, y, 'rx')
- 拟合一
%matplotlib inline
import numpy as np
import matplotlib.pyplot as plt

x = [13854,12213,11009,10655,9503]
x = np.reshape(x,newshape=(5,1)) / 10000.0
y =  [21332, 20162, 19138, 18621, 18016]
y = np.reshape(y,newshape=(5,1)) / 10000.0

plt.title("initial data")
plt.plot(x, y, 'rx')
plt.plot(x, lineRegressionFit(x, [0,0.1]), 'g-')
拟合二
将拟合一中的代码
plt.plot(x, lineRegressionFit(x, [0,0.1]), 'g-')
修改为
plt.plot(x, lineRegressionFit(x, [0,0.3]), 'g-')
其他保持不变
拟合三
将拟合一中的代码
plt.plot(x, lineRegressionFit(x, [0,0.1]), 'g-')
修改为
plt.plot(x, lineRegressionFit(x, [0,0.3]), 'g-')
其他保持不变
一元线性回归
引入
已知某些地区的程序员工资与算法工程师工资情况, 找出算法工程师和程序员之间的工资关系。这里直接给出北京,上海,杭州,深圳,广州的工资。
| 城市 | x-程序员工资 | y-算法工程师工资 |
|---|---|---|
| 北京 | 1.3854 | 2.1332 |
| 上海 | 1.2213 | 2.0162 |
| 杭州 | 1.1009 | 1.9138 |
| 深圳 | 1.0655 | 1.8621 |
| 广州 | 0.09503 | 1.8016 |
把他们用图打出来看看他们之间的关系。
- 代码
%matplotlib inline
import numpy as np
import matplotlib.pyplot as plt

x = [13854,12213,11009,10655,9503] #程序员工资,顺序为北京,上海,杭州,深圳,广州
x = np.reshape(x,newshape=(5,1)) / 10000.0
y =  [21332, 20162, 19138, 18621, 18016] #算法工程师,顺序和上面一致
y = np.reshape(y,newshape=(5,1)) / 10000.0
print(x)
print(y)
plt.title("initial data")
plt.plot(x, y, 'rx')
由图可见,他们之间大致是一个线性关系,这时候,我们就可以试着用一元线性回归去拟合(fit)他们之间的关系
一元线性回归公式
y = a ∗ x + b + ϵ y = a*x+b+\epsilon y=a∗x+b+ϵ
这个就是我们熟悉的一元线性方程了,是不是非常熟悉?其中
y 为因变量 dependent variable
x 为自变量 independent variable
a 为斜率 coeffient
b 为截距 intercept
ε (读作epsilon)为误差,正态分布
接下来是我们的理论模型公式了。
由于笔者主要是跟使用了吴恩达的《机器学习》,因此公式表达为
(1) h θ ( x ) = θ 0 + θ 1 ∗ x h_\theta(x) = \theta_0 + \theta_1*x \tag{1} hθ(x)=θ0+θ1∗x(1)
其中
h θ ( x ) = = > y h_\theta(x) ==>y hθ(x)==>y
θ 0 = = > b \theta_0 ==>b θ0 ==>b
θ 1 = = > a \theta_1 ==>a θ1 ==>a
当我们进行理论模拟的时候,认为ε 足够小,我们忽略不计,因此在上面的式子中省略了。
一元线性回归的目标
我们已经知道了一元线性回归的 公式,也知道了数据的自变量,因变量,也知道了我们的理论模型公式,那么未知的是我们的 θ 0 \theta_0 θ0, θ 1 \theta_1 θ1
我们的目标便是选择出合适的参数可以使得建模误差能够最小的模型参数。即
线性回归的目标是,找到一组 θ 0 \theta_0 θ0, θ 1 \theta_1 θ1,使得建模误差最小
那么,什么是建模误差?
模型所预测的值与训练集中实际值之间的差距
如下图(下图中蓝线所指,红色是样本,黑色的直线是建模函数模型)

红色的点为观测样本,即 y = a x + b + ε y=ax+b+ε y=ax+b+ε。
黑色的的直线为回归线,即 h θ ( x ) = θ 0 + θ 1 ∗ x h_\theta(x) = \theta_0 + \theta_1*x hθ(x)=θ0+θ1∗x
x蓝色的线段为误差,即 ε = h θ ( x ) − y ε=h_\theta(x) - y ε=hθ(x)−y
线性回归的流程
- 说明
这个流程是针对一下的分析而画的,初次阅读可先跳阅到到后面 《sklearn 线性回归函数代码》 ,查看大概的总体流程后,在回来继续往下阅读
单个样本点分析
损失函数
为了更好的表达我们的误差,我们使用了 ε 2 = ( h θ ( x ) − y ) 2 ε^2=(h_\theta(x) - y)^2 ε2=(hθ(x)−y)2 来描述我们的误差情况,并且令
(2) J ( θ ) = ϵ 2 J(\theta) = \epsilon^2 \tag{2} J(θ)=ϵ2(2)
J ( θ ) J(\theta) J(θ)叫做我们的建模误差,即损失函数
提示:这里叫做损失函数是有原因的,因为我们这里只是对一个样本数据进行操作
具体的区别请参考
(6条消息)机器学习中的目标函数、损失函数、代价函数有什么区别 - liuliqun520的博客 - CSDN博客
https://blog.csdn.net/liuliqun520/article/details/80032592
我们的目标便是选择出可以使得建模误差的平方和能够最小的模型参数。 即使得损失函数 J ( θ ) J(\theta) J(θ)最小,也就是说,我们通过这个方式,能够得到 θ 0 , θ 1 \theta_0, \theta_1 θ0,θ1的合适大小
即
J ( θ ) J(\theta) J(θ)最小 ======> θ 0 , θ 1 \theta_0, \theta_1 θ0,θ1的合适大小
为此,我们引入了梯度下降的方式,来找到 θ 0 , θ 1 \theta_0, \theta_1 θ0,θ1的合适大小
梯度下降(Gradient Descent )
什么是梯度下降算法?
我们先看一下损失函数 J ( θ ) J(\theta) J(θ) 的图像
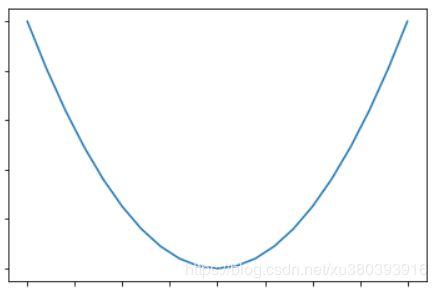
通过上面的图像,我们知道 J ( θ ) J(\theta) J(θ)在函数的底端取得最小值,此时 θ 0 , θ 1 \theta_0, \theta_1 θ0,θ1的有合适大小
但是我们怎么能够得到这个底端的位置呢?通过观察图像,发现曲线的切线方向是向着最低点进行的,切线的斜率是先小于零后大于零的
如图

切线的斜率就是我们对 J ( θ ) J(\theta) J(θ)求的导数,即
J ′ = ∂ J ( θ ) ∂ θ J' = \frac {\partial J(\theta)} {\partial \theta} J′=∂θ∂J(θ)
如果我们的参数每一次又迈进了一小步,重复上面的步骤,并依此类推,直到你接近局部最低点的位置,才停止。我们就可以每一次的切线的斜率,来对当前的位置进行修正,对应公式:
θ = θ − ∂ J ( θ ) ∂ θ \theta = \theta - \frac {\partial J(\theta)} {\partial \theta} θ=θ−∂θ∂J(θ)
上面的公式表示还不是特别的完整,因为我们迈出的步子可能还是很大,为了使迈出的步子更加的小,我们引入了一个叫做学习率 α \alpha α的参数,修正后的公式如下:
θ = θ − α ∗ ∂ J ( θ ) ∂ θ \theta = \theta - \alpha*\frac {\partial J(\theta)} {\partial \theta} θ=θ−α∗∂θ∂J(θ)
对应的示意图如下

− α ∗ ∂ J ( θ ) ∂ θ - \alpha*\frac {\partial J(\theta)} {\partial \theta} −α∗∂θ∂J(θ) 来更新 θ \theta θ 的原因:
在函数的左边的时候 J‘ <0, θ \theta θ 朝着右边更新,当切线斜率 J’ >0, θ \theta θ向左边调整
∂ J ( θ ) ∂ θ 0 = ∂ J ( θ 0 , θ 1 ) ∂ θ 0 = θ 0 − ∂ J ( θ ) ∂ θ \frac{\partial J(\theta)}{\partial \theta_0}=\frac{\partial J(\theta_0, \theta_1)}{\partial \theta_0} = \theta_0 - \frac {\partial J(\theta)} {\partial \theta} ∂θ0∂J(θ)=∂θ0∂J(θ0,θ1)=θ0−∂θ∂J(θ)
- 对于 θ 0 \theta_0 θ0 更新
(3) ∂ J ( θ ) ∂ θ 0 = ∂ J ( θ 0 , θ 1 ) ∂ θ 0 = 2 ∗ ( h θ ( x ) − y ) ∗ ∂ h ( θ ) ∂ θ 0 \frac {\partial J(\theta)} {\partial \theta_0} = \frac{\partial J(\theta_0, \theta_1)}{\partial \theta_0} = 2*(h_\theta(x) - y)* \frac {\partial h(\theta)} {\partial \theta_0} \tag{3} ∂θ0∂J(θ)=∂θ0∂J(θ0,θ1)=2∗(hθ(x)−y)∗∂θ0∂h(θ)(3)
由于 ∂ h ( θ ) ∂ θ 0 \frac {\partial h(\theta)} {\partial \theta_0} ∂θ0∂h(θ) = 1,因此公式(3)则为:
∂ J ( θ ) ∂ θ 0 = 2 ∗ ( h θ ( x ) − y ) ∗ 1 \frac {\partial J(\theta)} {\partial \theta_0}= 2*(h_\theta(x) - y)* 1 ∂θ0∂J(θ)=2∗(hθ(x)−y)∗1
故
θ 0 = θ 0 − α ∗ 2 ∗ ( h θ ( x ) − y ) ∗ 1 \theta_0 = \theta_0 - \alpha* 2*(h_\theta(x) - y)* 1 θ0=θ0−α∗2∗(hθ(x)−y)∗1
- 对于 θ 1 \theta_1 θ1 更新
(3) ∂ J ( θ ) ∂ θ 1 = ∂ J ( θ 0 , θ 1 ) ∂ θ 1 = 2 ∗ ( h θ ( x ) − y ) ∗ ∂ h ( θ ) ∂ θ 1 \frac {\partial J(\theta)} {\partial \theta_1} = \frac{\partial J(\theta_0, \theta_1)}{\partial \theta_1} = 2*(h_\theta(x) - y)* \frac {\partial h(\theta)} {\partial \theta_1} \tag{3} ∂θ1∂J(θ)=∂θ1∂J(θ0,θ1)=2∗(hθ(x)−y)∗∂θ1∂h(θ)(3)
由于 ∂ h ( θ ) ∂ θ 1 \frac {\partial h(\theta)} {\partial \theta_1} ∂θ1∂h(θ) = x,因此公式(3)则为:
∂ J ( θ ) ∂ θ 0 = 2 ∗ ( h θ ( x ) − y ) ∗ x \frac {\partial J(\theta)} {\partial \theta_0}= 2*(h_\theta(x) - y)* x ∂θ0∂J(θ)=2∗(hθ(x)−y)∗x
θ 1 = θ 1 − α ∗ 2 ∗ ( h θ ( x ) − y ) ∗ x \theta_1 = \theta_1 - \alpha* 2*(h_\theta(x) - y)* x θ1=θ1−α∗2∗(hθ(x)−y)∗x
看到这里,怎么发现这个更新公式和吴恩达的讲解的不一样,请看下面
多个样本点
多个样本点的时候后,原理同单个原本点分析差不多,但是不同的是我们的有些名词还有表示需要改变一下,由于原理差不多,对所改变的地方则在下面提出
假设,我们现在有m个 数据训练样本
损失函数
在多个样本的时候,我们不再叫做损失函数,而是叫做代价函数
损失函数 ==> 代价函数
代价函数修改为:
J ( θ ) = J ( θ 0 , θ 1 ) = 1 2 ∗ m ∑ i = 1 m ( h θ ( x ) − y ) 2 J(\theta) = J(\theta_0, \theta_1) =\frac{1}{2*m} \sum_{i=1}^m(h_\theta(x) - y)^2 J(θ)=J(θ0,θ1)=2∗m1i=1∑m(hθ(x)−y)2
- 为什么是这样子呢?
因为在多个训练样本的时候,我们取得误差是所有的误差的均值,因此先求和,后乘以 1 m \frac{1}{m} m1, - 那么 1 2 \frac{1}{2} 21是怎么来的?
这个是为了后面进行求梯度下降的时候补充的一个系数。
梯度下降(Gradient Descent )
线性回归参数修改为
θ 0 = θ 0 − α ∗ 1 m ∗ ∑ i = 1 m ( h θ ( x ) − y ) ∗ 1 \theta_0 = \theta_0 - \alpha* \frac{1}{m}* \sum_{i=1}^m(h_\theta(x) - y)* 1 θ0=θ0−α∗m1∗i=1∑m(hθ(x)−y)∗1
θ 1 = θ 1 − α ∗ 1 m ∗ ∑ i = 1 m ( h θ ( x ) − y ) ∗ x \theta_1 = \theta_1 - \alpha*\frac{1}{m} * \sum_{i=1}^m(h_\theta(x) - y)* x θ1=θ1−α∗m1∗i=1∑m(hθ(x)−y)∗x
代码实现
理论分析已经告一段落了,接下来我们来实现一下相关的代码
建议在看的时候,先看看前面的 《线性回归的流程》
训练模型函数
这个是用来训练用的,事对自变量的矩阵运算
def h(x, theta):
    '''
    理论模拟模型h(theta0, theta1)
    :param x:  已知的数据自变量 x
    :param theta:  线性回归参数 theta
    :return: 线性回归结果 y
    '''
    return np.dot(x, theta)  # 矩阵相乘
模型拟合函数
这个是只对单个的数据集计算
def lineRegressionFit(xInput, theta):
    '''
    训练好的模型拟合函数
    :param xInput: 自变量x
    :param theta:  训练好的线性回归参数
    :return:  拟合结果
    '''
    return theta[0] + theta[1] * xInput
损失函数(代价函数)
def computeCost(x, y, ySize, theta):
    '''
    代价函数
    :param x:   已知的数据自变量 x
    :param y:
    :param ySize:
    :param theta:  线性回归参数 theta
    :return:
    '''
    return (float)(1. / (2 * ySize) * np.dot((h(x, theta) - y).T, h(x, theta) - y))
梯度下降算法
def descendGradient(theta, alpha, ySize):
    '''
    梯度下降算法
    :param theta: 线性回归
    :param alpha: 学习率( learning rate)
    :param ySize:  y的行数
    :return: 优化后的参数theta
    '''
    for i in range(len(theta)):
        theta[i] = theta[i] - (alpha / ySize) * np.sum((h(x, theta) - y) * np.array(x[:, i]).reshape(ySize, 1))
    return theta
迭代函数
def trainIteration(iteration, theta, alpha, ySize):
    '''
    迭代函数,控制训练的程度
    :param iteration: 迭代次数
    :param theta:      线性回归参数
    :param alpha:     学习率
    :param ySize:      y的行数,训练样本的数量
    :return:           theta, thetaHistory, computeCostHistory
    '''
    # 多个迭代, 多次优化
    thetaHistory = []  # 记录 theta 的更新历史
    computeCostHistory = []  # 记录代价函数 computeCost 的更新历史
    for meaninglessvariable in range(iteration):
        thetaHistory.append(list(theta[:, 0]))  # 括号内是 theta.T 可以么????
        computeCostHistory.append(computeCost(x, y, ySize, theta))
        # 梯度下降
        theta = descendGradient(theta, alpha, ySize)
    return theta, thetaHistory, computeCostHistory
画图显示
def plotFigure(thetaResult, xInput, yInput, yFitResult ):
    '''
    一元线性回归 画图
    :param thetaResult:
    :param xInput:
    :param yInput:
    :param yFitResult:
    :return:
    '''
    plt.figure(figsize=(10, 6))
    # 原始数据
    plt.plot(xInput, yInput, 'rx', markersize=10, label='Train Data')

    # 训练好的模型数据
    plt.plot(xInput, yFitResult, 'b-', markersize=1,
             label='Hypothesis: %0.2f + % 0.2fx' % (thetaResult[0], thetaResult[1]))
    plt.grid(True)
    plt.xlabel('x')
    plt.ylabel('y')
    plt.title('fit data')
    plt.legend()
    plt.show()
完整的代码
- 说明
以下部分所涉及的到的代码,以及相关的数据集均可下载。
手写线性回归函数代码
实现的流程步骤请参考前面的《线性回归的流程》
- 代码文件名称
SimpleOneLinerRegression_BySelf.py.py
import matplotlib.pyplot as plt
import numpy as np

def readFile(filePath, contentDelimiter, contentCols, transposition):
    '''
    读取数据
    :param filePath:    文件路径
    :param conteentDelimiter:  传入字符串,文件内容分割符,如 ','
    :param conteentCols:        传入元祖,文件内容读取列,如(0,1) 读取列0,1
    :param transposition:       布尔值,如True,则转置
    :return:
    '''
    return np.loadtxt(filePath, delimiter=contentDelimiter, usecols=contentCols,
                      unpack=transposition)  # Read in comma separated data

def h(x, theta):
    '''
    理论模拟模型h(theta0, theta1)
    :param x:  已知的数据自变量 x
    :param theta:  线性回归参数 theta
    :return: 线性回归结果 y
    '''
    return np.dot(x, theta)  # 矩阵相乘


def computeCost(x, y, ySize, theta):
    '''
    代价函数
    :param x:   已知的数据自变量 x
    :param y:
    :param ySize:
    :param theta:  线性回归参数 theta
    :return:
    '''
    return (float)(1. / (2 * ySize) * np.dot((h(x, theta) - y).T, h(x, theta) - y))


def descendGradient(theta, alpha, ySize):
    '''
    梯度下降算法
    :param theta: 线性回归
    :param alpha: 学习率( learning rate)
    :param ySize:  y的行数
    :return: 优化后的参数theta
    '''
    for i in range(len(theta)):
        theta[i] = theta[i] - (alpha / ySize) * np.sum((h(x, theta) - y) * np.array(x[:, i]).reshape(ySize, 1))
    return theta


def trainIteration(iteration, theta, alpha, ySize):
    '''
    迭代函数,控制训练的程度
    :param iteration: 迭代次数
    :param theta:      线性回归参数
    :param alpha:     学习率
    :param ySize:      y的行数,训练样本的数量
    :return:           theta, thetaHistory, computeCostHistory
    '''
    # 多个迭代, 多次优化
    thetaHistory = []  # 记录 theta 的更新历史
    computeCostHistory = []  # 记录代价函数 computeCost 的更新历史
    for meaninglessvariable in range(iteration):
        thetaHistory.append(list(theta[:, 0]))  # 括号内是 theta.T 可以么????
        computeCostHistory.append(computeCost(x, y, ySize, theta))
        # 梯度下降
        theta = descendGradient(theta, alpha, ySize)
    return theta, thetaHistory, computeCostHistory


def lineRegressionFit(xInput, theta):
    '''
    训练好的模型拟合函数
    :param xInput: 自变量x
    :param theta:  训练好的线性回归参数
    :return:  拟合结果
    '''
    return theta[0] + theta[1] * xInput


def plotFigure(thetaResult, xInput, yInput, yFitResult ):
    '''
    一元线性回归 画图
    :param thetaResult:
    :param xInput:
    :param yInput:
    :param yFitResult:
    :return:
    '''
    plt.figure(figsize=(10, 6))
    # 原始数据
    plt.plot(xInput, yInput, 'rx', markersize=10, label='Train Data')

    # 训练好的模型数据
    plt.plot(xInput, yFitResult, 'b-', markersize=1,
             label='Hypothesis: %0.2f + % 0.2fx' % (thetaResult[0], thetaResult[1]))
    plt.grid(True)
    plt.xlabel('x')
    plt.ylabel('y')
    plt.title('fit data')
    plt.legend()
    plt.show()


if __name__ == '__main__':
    x = [13854, 12213, 11009, 10655, 9503]  # 程序员工资,顺序为北京,上海,杭州,深圳,广州
    x = np.reshape(x, newshape=(5, 1)) / 10000.0
    y = [21332, 20162, 19138, 18621, 18016]  # 算法工程师,顺序和上面一致
    y = np.reshape(y, newshape=(5, 1)) / 10000.0

    x = np.insert(x, 0, [1], axis=1)
    ySize = y.size  # y 的行数
    # 初始化
    thetaInitial = np.zeros((x.shape[1], y.shape[1]))
    alpha = 0.01
    iteration = 1500

    # 训练并获取相关的结果
    theta, thetaHistory, computeCostHistory = trainIteration(iteration, thetaInitial, alpha, ySize)
    print(theta)
    xInput = x[:, 1]
    yInput = y[:, 0]
    # print(xInput, yInput)

    # 拟合的 y
    yFit = lineRegressionFit(xInput, theta)
    # plotFigure(theta)
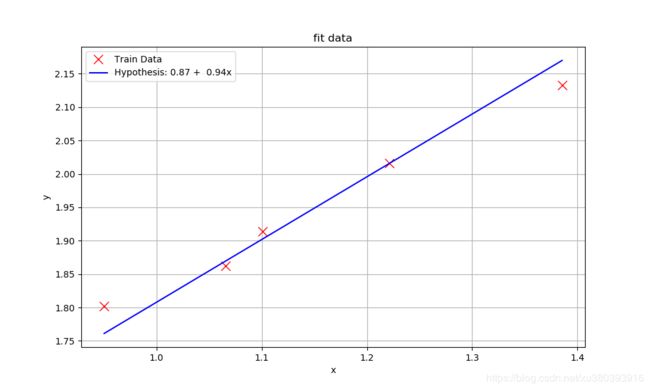
    plotFigure(thetaResult=theta, xInput=xInput, yInput=yInput, yFitResult=yFit)
sklearn 线性回归函数代码
采用 sklearn 库来实现对数据集的预测。采用sklearn 的好处在于,代码非常的短,因为相关的算法已经被写好了,我们只用调用就可以了。
实现的步骤如下:
- 代码文件名称
SimpleOneLinerRegression_sklearn.py
#!/usr/bin/env python
# -*- coding:utf-8 -*-
import numpy as np
from sklearn.linear_model import LinearRegression
import matplotlib.pyplot as plt

x = [13854, 12213, 11009, 10655, 9503]  # 程序员工资,顺序为北京,上海,杭州,深圳,广州
x = np.reshape(x, newshape=(5, 1)) / 10000.0
y = [21332, 20162, 19138, 18621, 18016]  # 算法工程师,顺序和上面一致
y = np.reshape(y, newshape=(5, 1)) / 10000.0
# 调用模型
lr = LinearRegression()
# 训练模型
lr.fit(x, y)
# 计算R平方
print( lr.score(x, y))
# 计算y_hat
y_hat = lr.predict(x)
# 打印出图
plt.plot(x, y, 'rx', markersize=10)
plt.plot(x, y_hat, 'g-')

plt.xlabel('x')
plt.ylabel('y')
plt.title('fit data')
plt.show()
拟合的效果图
吴恩达机器学习线性回归案例
- 案例信息
Suppose you are the CEO of a restaurant franchise and are considering different cities for opening a new outlet. The chain already has trucks in various cities and you have data for
profits and populations from the cities.
You would like to use this data to help you select which city to expand
to next.
The file ex1data1.txt contains the dataset for our linear regression problem. The first column is the population of a city and the second column is
the profit of a food truck in that city. A negative value for profit indicates a
loss
-
已知数据文件名称
ex1data1.txt -
关于读取数据的说明
1、读取数据
datafile 中的数据是 97行 2列
loadtxt 读出来后 cols 是2行97列的数据
2、获取 x,y 数据,
这里 x 97行,1列
y 97行,1列,
并对 x 的数据进行处理,插入全为 1 的,使其成为 97行 2 列
这里是实际y
3、模型函数
y预测 = h = theta0x0 + theta1x1
4、代价函数
J = 1/(2m)(y预测 - 实际y)*(y预测 - 实际y)
5、梯度下降
见梯度下降公式
6、设定学习迭代
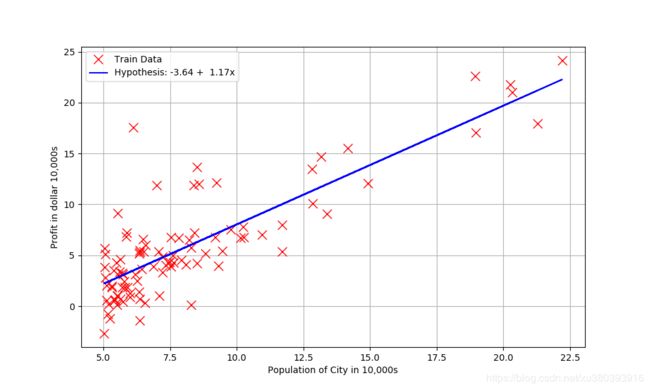
7、完成训练,画图显示效果
手写线性回归
- 代码文件名称
Exercise1_ LinearRegression.py
#!/usr/bin/env python
# -*- coding:utf-8 -*-
import matplotlib.pyplot as plt
import numpy as np

def readFile(filePath, contentDelimiter, contentCols, transposition):
    '''
    读取数据
    :param filePath:    文件路径
    :param conteentDelimiter:  传入字符串,文件内容分割符,如 ','
    :param conteentCols:        传入元祖,文件内容读取列,如(0,1) 读取列0,1
    :param transposition:       布尔值,如True,则转置
    :return:
    '''
    return np.loadtxt(filePath, delimiter=contentDelimiter, usecols=contentCols,
                      unpack=transposition)  # Read in comma separated data


def h(x, theta):
    '''
    理论模拟模型h(theta0, theta1)
    :param x:  已知的数据自变量 x
    :param theta:  线性回归参数 theta
    :return: 线性回归结果 y
    '''
    return np.dot(x, theta)  # 矩阵相乘


def computeCost(x, y, ySize, theta):
    '''
    代价函数
    :param x:   已知的数据自变量 x
    :param y:
    :param ySize:
    :param theta:  线性回归参数 theta
    :return:
    '''
    return (float)(1. / (2 * ySize) * np.dot((h(x, theta) - y).T, h(x, theta) - y))


def descendGradient(theta, alpha, ySize):
    '''
    梯度下降算法
    :param theta: 线性回归
    :param alpha: 学习率( learning rate)
    :param ySize:  y的行数
    :return: 优化后的参数theta
    '''
    for i in range(len(theta)):
        theta[i] = theta[i] - (alpha / ySize) * np.sum((h(x, theta) - y) * np.array(x[:, i]).reshape(ySize, 1))
    return theta


def trainIteration(iteration, theta, alpha, ySize):
    '''
    迭代函数,控制训练的程度
    :param iteration: 迭代次数
    :param theta:      线性回归参数
    :param alpha:     学习率
    :param ySize:      y的行数,训练样本的数量
    :return:           theta, thetaHistory, computeCostHistory
    '''
    # 多个迭代, 多次优化
    thetaHistory = []  # 记录 theta 的更新历史
    computeCostHistory = []  # 记录代价函数 computeCost 的更新历史
    for meaninglessvariable in range(iteration):
        thetaHistory.append(list(theta[:, 0]))  # 括号内是 theta.T 可以么????
        computeCostHistory.append(computeCost(x, y, ySize, theta))
        # 梯度下降
        theta = descendGradient(theta, alpha, ySize)
    return theta, thetaHistory, computeCostHistory


def lineRegressionFit(xInput, theta):
    '''
    训练好的模型拟合函数
    :param xInput: 自变量x
    :param theta:  训练好的线性回归参数
    :return:  拟合结果
    '''
    return theta[0] + theta[1] * xInput


def plotFigure(thetaResult, xInput, yInput, yFitResult ):
    '''
    一元线性回归 画图
    :param thetaResult:
    :param xInput:
    :param yInput:
    :param yFitResult:
    :return:
    '''
    plt.figure(figsize=(10, 6))
    # 原始数据
    plt.plot(xInput, yInput, 'rx', markersize=10, label='Train Data')

    # 训练好的模型数据
    plt.plot(xInput, yFitResult, 'b-', markersize=1,
             label='Hypothesis: %0.2f + % 0.2fx' % (thetaResult[0], thetaResult[1]))
    plt.grid(True)
    plt.xlabel('Population of City in 10,000s')
    plt.ylabel('Profit in dollar 10,000s')
    plt.legend()
    plt.show()


if __name__ == '__main__':
    # 1、读取数据
    cols = readFile(filePath='./ex1data1.txt', contentDelimiter=',', contentCols=(0, 1), transposition=True)

    # 2、获取 x,y 数据,
    # -1 指的就是现后一行
    x = np.transpose(np.array(cols[:-1]))  # cols[:-1]实际上对应的就是  cols[:0]
    y = np.transpose(np.array(cols[-1:]))  # cols[-1:]实际上对应的就是  cols[1:2]
    print(x, y)
    x = np.insert(x, 0, [1], axis=1)
    ySize = y.size  # y 的行数
    # 初始化
    thetaInitial = np.zeros((x.shape[1], y.shape[1]))
    alpha = 0.01
    iteration = 1500

    # 训练并获取相关的结果
    theta, thetaHistory, computeCostHistory = trainIteration(iteration, thetaInitial, alpha, ySize)
    print(theta)
    xInput = x[:, 1]
    yInput = y[:, 0]
    # print(xInput, yInput)

    # 拟合的 y
    yFit = lineRegressionFit(xInput, theta)
    # plotFigure(theta)
    plotFigure(thetaResult=theta, xInput=xInput, yInput=yInput, yFitResult=yFit)
sklearn 线性回归函数代码
- 代码文件名称
Exercise1_ LinearRegressionWith_sklearn.py
#!/usr/bin/env python
# -*- coding:utf-8 -*-
import matplotlib.pyplot as plt
import numpy as np
from sklearn.linear_model import LinearRegression


def readFile(filePath, contentDelimiter, contentCols, transposition):
    '''
    读取数据
    :param filePath:    文件路径
    :param conteentDelimiter:  传入字符串,文件内容分割符,如 ','
    :param conteentCols:        传入元祖,文件内容读取列,如(0,1) 读取列0,1
    :param transposition:       布尔值,如True,则转置
    :return:
    '''
    return np.loadtxt(filePath, delimiter=contentDelimiter, usecols=contentCols,
                      unpack=transposition)  # Read in comma separated data

def h(x, theta):
    '''
    理论模拟模型h(theta0, theta1)
    :param x:  已知的数据自变量 x
    :param theta:  线性回归参数 theta
    :return: 线性回归结果 y
    '''
    return np.dot(x, theta)  # 矩阵相乘


if __name__ == '__main__':
    # 读取数据,2行97列
    cols = readFile(filePath='./ex1data1.txt', contentDelimiter=',', contentCols=(0, 1), transposition=True)
    # 获取 x, y的数据,都是 97行1列
    x = np.transpose(np.array(cols[:-1]))  # cols[:-1]实际上对应的就是  cols[:0], ,即读取所有行第0列的数据
    y = np.transpose(np.array(cols[-1:]))  # cols[-1:]实际上对应的就是  cols[1:2],,即读取所有行第1列的数据
    # 创建线性回归实例
    lr = LinearRegression()
    # 拟合
    lr.fit(x, y)
    # 打印拟合效果
    print(lr.score(x, y))
    # 预测效果
    y_hat = lr.predict(x)
    # 画图
    plt.plot(x, y, 'rx', markersize=10,label='Training Data') # 原来的数据
    plt.plot(x, y_hat, 'b-', label='Fit Line')            # 现在的拟合后的曲线
    plt.grid(True)
    plt.xlabel('Population of City in 10,000s')
    plt.ylabel('Profit in dollar 10,000s')
    plt.legend()
    plt.show()
参考资料
(6条消息)手把手教你用Python写线性回归 - juwikuang的专栏 - CSDN博客
https://blog.csdn.net/juwikuang/article/details/78420337
本文章的相关代码与数据下载
一元线性回归相关代码-CSDN下载
https://download.csdn.net/download/xu380393916/10996890
如果觉得总结的还可以,记得送个赞(っ•̀ω•́)っ✎⁾⁾ 我爱学习


