深度学习 | 实战9- 参数正则化
————————————————————————————
原文发表于夏木青 | JoselynZhao Blog,欢迎访问博文原文。
————————————————————————————
Github源码
深度学习教程与实战案列系列文章
深度学习 | 绪论
深度学习 | 线性代数基础
深度学习 | 机器学习基础
深度学习 | 实践方法论
深度学习 | 应用
深度学习 | 安装conda、opencv、pycharm以及相关问题
深度学习 | 工具及实践(TensorFlow)
深度学习 | TensorFlow 命名机制和变量共享、变量赋值与模型封装
深度学习 | TFSlim介绍
深度学习 | TensorFlow可视化
深度学习 | 训练及优化方法
深度学习 | 模型评估与梯度下降优化
深度学习 | 物体检测
深度学习| 实战1-python基本操作
深度学习 | 实战2-TensorFlow基础
深度学习 | 实战3-设计变量共享网络进行MNIST分类
深度学习 | 实战4-将LENET封装为class,并进行分类
深度学习 | 实战5-用slim 定义Lenet网络,并训练测试
深度学习 | 实战6-利用tensorboard实现卷积可视化
深度学习 | 实战7- 连体网络MINIST优化
深度学习 | 实战8 - 梯度截断
深度学习 | 实战9- 参数正则化
要求
参数正则化
(一)要求:训练MNIST分类模型,比较不同学习率情况下,loss的收敛情况和实际精度acc的变化情况。比较添加参数正则化方法防止模型过拟合的效果。
模型结构要求:使用如下全连接网络:
def model(x):
    w1=tf.Variable(dtype=tf.float32, initial_value=np.random.rand(784,1500))
    w2=tf.Variable(dtype=tf.float32, initial_value=np.random.rand(1500,1000))
    w3=tf.Variable(dtype=tf.float32, initial_value=np.random.rand(1000,500),name='w3')
    w4=tf.Variable(dtype=tf.float32, initial_value=np.random.rand(500,10),name='w4')
    b1=tf.Variable(dtype=tf.float32, initial_value=np.random.rand(1500))
    b2=tf.Variable(dtype=tf.float32, initial_value=np.random.rand(1000))
    b3=tf.Variable(dtype=tf.float32, initial_value=np.random.rand(500))
    b4=tf.Variable(dtype=tf.float32, initial_value=np.random.rand(10))

    fc1=tf.nn.relu(tf.matmul(x,w1)+b1)
    fc2=tf.nn.relu(tf.matmul(fc1,w2)+b2)
    fc3=tf.nn.relu(tf.matmul(fc2,w3)+b3)
    fc4=tf.matmul(fc3,w4)+b4
    return fc4
参数设置:batchsize=64, 迭代30000次,使用AdamOptimizer
实验内容:1. 比较学习率lr=0.0001 和lr=0.005时的网络学习效果。画出training loss, validation loss, validation acc曲线(每100次迭代记一下。为了更容易看出后期起伏效果,可单独再绘制一条曲线,不包含前20个左右的记录点(loss快速降落的区域)使得后期变化能够加显著的被可视化。)。给出最终网络的test acc以及 网络中w1,w2,w3,w4的参数矩阵可视化图。观察,是否某些lr会在训练中间,有精度先上升并保持一段时间(acc甚至到0.95左右维持一段时间),后来acc又开始下降,但loss却一直保持下降的情况?其他规律?不同lr最后的收敛效果?(感兴趣的可以看一下lr=0.05,lr=0.00005的情况)
- 比较lr=0.005时,使用参数正则化和不使用参数正则化(l2正则化推荐lamda 0.0005)的训练效果。画出training loss, validation loss, validation acc曲线(每100次迭代记一下)。给出最终网络的test acc以及 网络中w1,w2,w3,w4的参数矩阵可视化图。正则化是否提升了网络训练效果?参数矩阵比较,是否稀疏化了?
提交:1. 实验报告:包括如上所要求曲线图、参数可视化图以及其他要求数据;实验截图。2. 代码。
实验与结果
运行截图
图 1运行截图
比较学习率lr=0.0001 和lr=0.005时的网络学习效果
图 2 lr = 0.005 时的accuracy
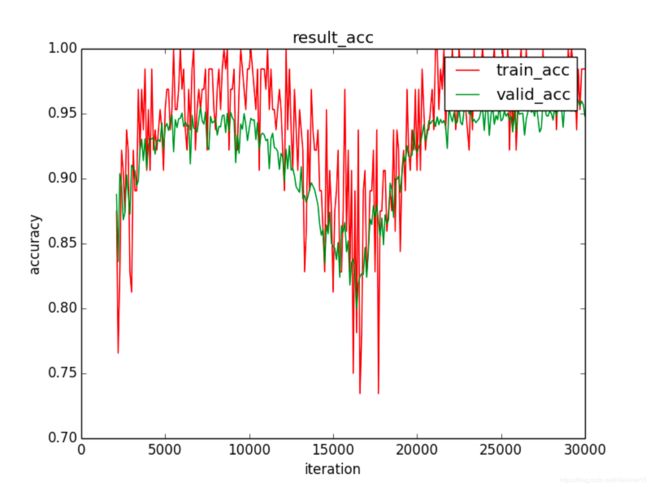
图 3 lr = 0.005 时的loss
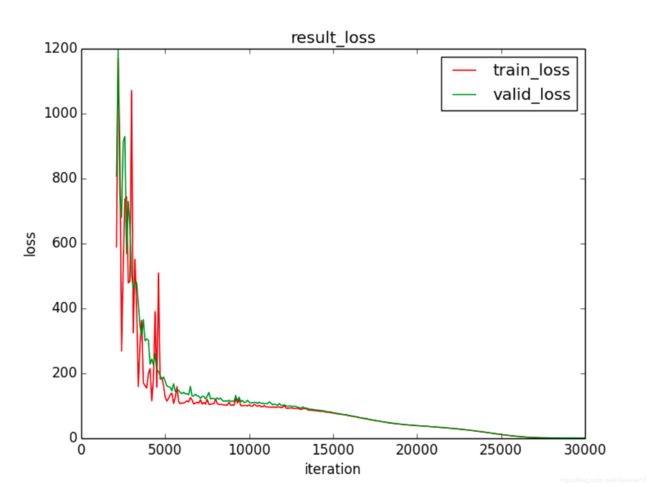
图 4 lr = 0.005时 参数矩阵可视化图

图 5 lr = 0.0001 时的accuracy
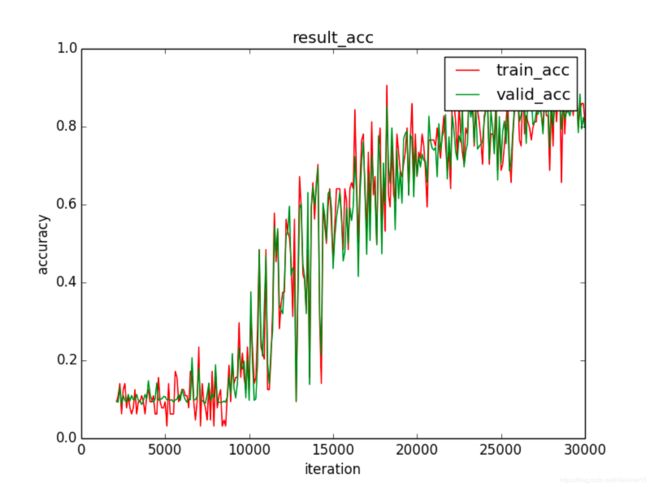
图 6 lr = 0.0001 时的loss
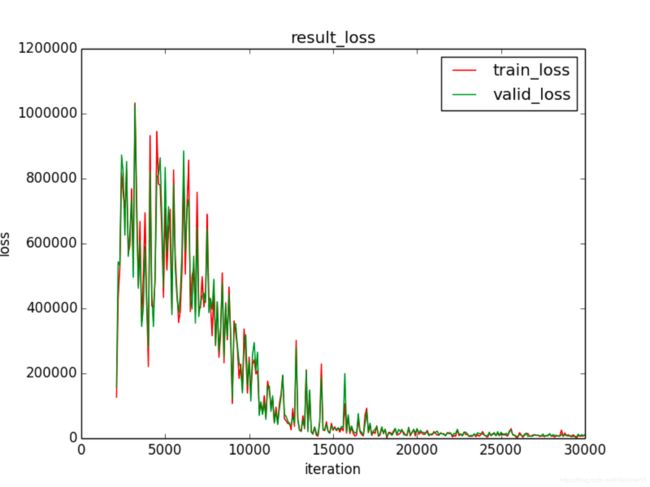
图 7 lr = 0.0001 时的参数矩阵可视化图
比较lr=0.005时,使用参数正则化和不使用参数正则化的训练效果
参数正则化的accuracy 、loss、参数矩阵可视化图分别如图2,图3,图4所示。
不使用参数正则化的效果如下。
图 8 无正则化 accuracy
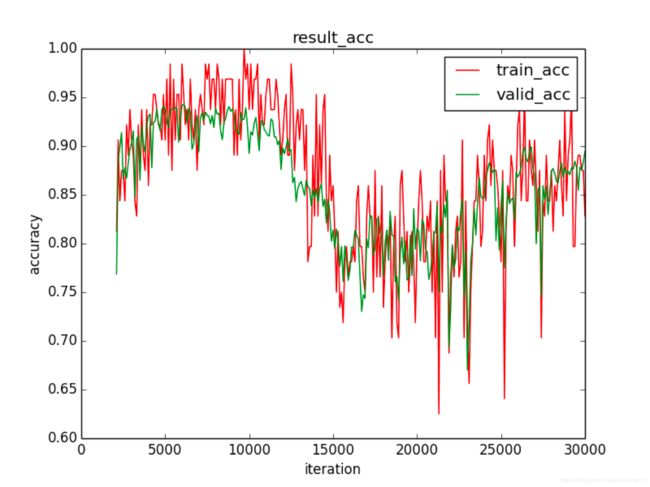
图 9 无正则化 loss
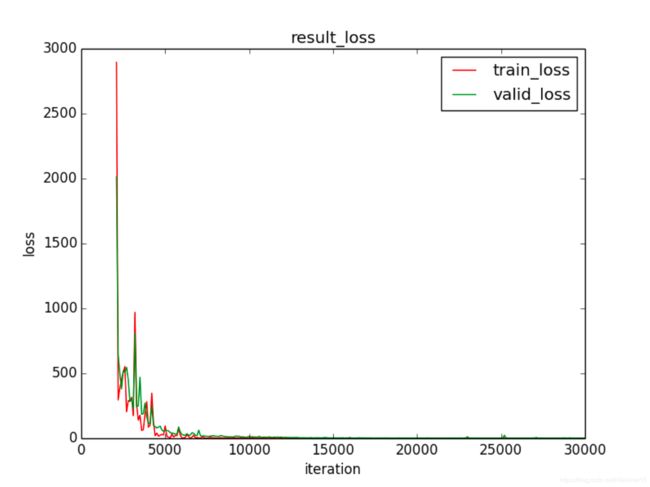
图 10 无正则化参数矩阵可视化图
网络在无正则化的情况下test acc为0.88,正则化之后为0.92.
正则化的使用提升了网络训练效果,参数矩阵稀疏化了。
源码展示
def model(x):
    w1 = tf.Variable(dtype=tf.float32, initial_value=np.random.rand(784, 1500),name='w1')
    w2 = tf.Variable(dtype=tf.float32, initial_value=np.random.rand(1500, 1000),name ='w2')
    w3 = tf.Variable(dtype=tf.float32, initial_value=np.random.rand(1000, 500), name='w3')
    w4 = tf.Variable(dtype=tf.float32, initial_value=np.random.rand(500, 10), name='w4')
    b1 = tf.Variable(dtype=tf.float32, initial_value=np.random.rand(1500))
    b2 = tf.Variable(dtype=tf.float32, initial_value=np.random.rand(1000))
    b3 = tf.Variable(dtype=tf.float32, initial_value=np.random.rand(500))
    b4 = tf.Variable(dtype=tf.float32, initial_value=np.random.rand(10))

    fc1 = tf.nn.relu(tf.matmul(x, w1) + b1)
    fc2 = tf.nn.relu(tf.matmul(fc1, w2) + b2)
    fc3 = tf.nn.relu(tf.matmul(fc2, w3) + b3)
    fc4 = tf.matmul(fc3, w4) + b4
    return fc4


if __name__ =="__main__":

    iteratons = 30000
    batch_size = 64
    ma = 0
    sigma = 0.1
    lr = 0.005

    input_image = tf.placeholder(tf.float32, [None, 784])
    input_label = tf.placeholder(tf.float32, [None, 10])

    logits = model(input_image)
    # 注意,使用softmax_cross_entropy_with_logits_v2时,logits对应fc直接输出,不要再加softmax
    loss = tf.nn.softmax_cross_entropy_with_logits_v2(labels=input_label, logits=logits)
    loss = tf.reduce_mean(loss)

    tv = tf.trainable_variables()
    lambda_l = 0.0005
    Regularization_term = lambda_l * tf.reduce_sum([tf.nn.l2_loss(v) for v in tv])

    loss = Regularization_term + loss

    train_op = tf.train.AdamOptimizer(lr).minimize(loss)

    # 准确率
    correct_prediction = tf.equal(tf.argmax(tf.nn.softmax(logits), 1), tf.argmax(input_label, 1))
    accuracy = tf.reduce_mean(tf.cast(correct_prediction, tf.float32))

    iteration_index = []
    tr_loss = []
    tr_acc =[]
    valid_acc = []
    valid_loss = []

    with tf.Session() as sess:
        mnist = input_data.read_data_sets('../../../data/mnist', one_hot=True)
        sess.run(tf.global_variables_initializer())
        validation_images = mnist.validation.images
        validation_labels = mnist.validation.labels
        test_images = mnist.test.images
        test_labels = mnist.test.labels
        for ii in range(iteratons):
            batch_xs, batch_ys = mnist.train.next_batch(batch_size)
            sess.run(train_op, feed_dict={input_image: batch_xs, input_label: batch_ys})
            if  ii % 100 == 99:
                train_loss,train_accu = sess.run([loss,accuracy], feed_dict={input_image: batch_xs, input_label: batch_ys})
                validation_loss,validation_accu = sess.run([loss,accuracy],
                                           feed_dict={input_image: validation_images, input_label: validation_labels})
                print("Iter [%5d/%5d]: train acc is: %4f train loss is: %4f valid acc is :%4f valid loss is: %4f" % (ii, iteratons, train_accu, train_loss, validation_accu,validation_loss))
                if ii>2000:
                    iteration_index.append(ii)
                    tr_loss.append(train_loss)
                    tr_acc.append(train_accu)
                    valid_acc.append(validation_accu)
                    valid_loss.append(validation_loss)

        acc = sess.run(accuracy,feed_dict={input_image: test_images,input_label: test_labels})
        print("Test: accuracy is %4f" % (acc))

        plt.plot(iteration_index, tr_loss, 'r', label="train_loss")
        plt.plot(iteration_index, valid_loss, 'g',label ="valid_loss")
        plt.xlabel("iteration")
        plt.ylabel("loss")
        plt.legend()
        plt.title("result_loss")
        plt.savefig('./result_loss3.png')
        plt.show()

        plt.plot(iteration_index, tr_acc, 'r', label="train_acc")
        plt.plot(iteration_index, valid_acc, 'g',label ="valid_acc")
        plt.xlabel("iteration")
        plt.ylabel("accuracy")
        plt.legend()
        plt.title("result_acc")
        plt.savefig('./result_acc3.png')
        plt.show()

        plt.figure()
        for i in range(1,5,1):
            w1=sess.run('w'+str(i)+':0')
            w1_min = np.min(w1)
            w1_max = np.max(w1)
            w1_0_to_1 = (w1 - w1_min) / (w1_max - w1_min)
            plt.subplot(2,2,i-1)
            plt.title('w'+str(i))
            plt.imshow(w1_0_to_1)
        plt.savefig('./weight3.png')
        plt.show()