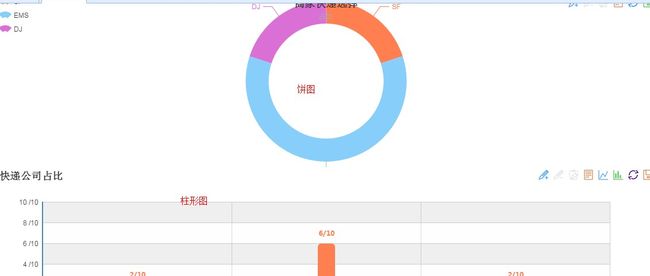
ehcart 多图 饼图和柱状图 echart多图加载问题
 需要注意的是:
1,数据还是从java后台传过来的,格式都是对应的,前台直接解析就可以,不用处理了,两个图表和一个还是有些区别的,这个不是联动的,饼图和柱形图放在一起,感觉还是有些问题的,就是2,里面说的问题,也不知时什么原因造成的,那样写了就可以了,像网上那些例子那么做是只能出来第一个结果,第二个柱形图显示不出来。
2,在加载柱形图的时候,下面这句不能像以前那样写,不然执行不了,不知道什么原因,再有就是下面ajax动态赋值的时候,直接写option.这样赋值,不然也是不能赋值,mychart.getOption.这样是执行不了的,不知道原因。
var option = myChart2.getOption =
<body>

        <div id="chartArea1" style="height:400px">div>
        <div id="wrong-message" style="color:blue;  font:bold 20px 宋体;">div>
        <div id="chartArea2" style="height:300px">div>
    <script type="text/javascript" language="javascript">
    //echart的加载路径
    require.config({
        paths : {
            'echarts' : '' ,
            'echarts/chart/bar' : '', //需要的组件
            'echarts/chart/pie' : '' //需要的组件
        }
    });
    //echart需要的组件
    require(
        [ 'echarts',
          'echarts/chart/bar',
          'echarts/chart/pie'
        ], DrawCharts //异步加载的回调函数绘制图表
    );
    //多图调用2个函数
    function DrawCharts(ec) {
        FunDraw1(ec);
        FunDraw2(ec);
    }
    function FunDraw1(ec) {
        //初始化第一个dom,饼图
        var myChart1 = ec.init(document.getElementById('chartArea1'));
        var option1 =  {
                title : {
                    text: '',
                    subtext: '',
                    x:'center'
                },
                tooltip : {
                    trigger: 'item',
                    formatter: "{a}
{b} : {c} ({d}%)"
                },
                legend: {
                    orient : 'vertical',
                    x : 'left',
                    data:[]
                },
                toolbox: {
                    show : true,
                    feature : {
                        mark : {show: true},
                        dataView : {show: true, readOnly: false},
                        magicType : {
                            type: ['pie']
                        },
                        restore : {show: true},
                        saveAsImage : {show: true}
                    }
                },
                calculable : false,
                series : [
                    {
                        name:'',
                        type:'pie',
                        selectedMode: 'single',
                        radius : [100, 140],
                        //center: ['50%', '60%'],
                        //饼图样式,是否显示链接线
                        itemStyle : {
                            normal : {
                                labelLine : {
                                    show : true
                                }
                            }
                        },
                        data:[]
                    }
                ]

            };
        myChart1.hideLoading();
        myChart1.setOption(option1);
        getChartData1();//ajax后台交互
        function getChartData1() {
            //获得图表的options对象
            var optionsPie = myChart1.getOption();
            //通过Ajax获取数据
            $.ajax({
                type : "post",
                async : false, //同步执行                  url:"${pageContext.request.contextPath}/order/login/pie_data.do",
                //data:{},
                dataType:"json", //返回数据形式为json
                success:function(result) {
                    if (result) {
                        optionsPie.legend.data = result[0].legend;
                        optionsPie.series[0].data = result[0].series;
                        //options.xAxis[0].data = result.category;
                        myChart1.hideLoading();
                        myChart1.setOption(optionsPie);
                    }
                },
                error : function(errorMsg) {
                    alert("不好意思,请求数据出错");
                    myChart1.hideLoading();
                }
         });
    };
    //饼图的点击事件
    var ecConfig = require('echarts/config');
    myChart1.on(ecConfig.EVENT.PIE_SELECTED, function (param){
         var selected = param.selected;
            var serie;
            var str = '当前选择: ';
            for (var idx in selected) {
                serie = myChart1.getOption().series[idx];
                for (var i = 0, l = serie.data.length; i < l; i++) {
                    if (selected[idx][i]) {
                        str += '【】' + serie.data[i].name + ' : ' +
                               '【】' + serie.data[i].value + ' '+
                               '【】' + (serie.data[i].value/10)*100 + '% ';
                    }
                }
            }
            document.getElementById('wrong-message').innerHTML = str;
    });
   }
    //第二个函数,柱状图
    function FunDraw2(ec) {
        var myChart2 = ec.init(document.getElementById('chartArea2'));
        myChart2.hideLoading();
        var option = myChart2.getOption = ({
            title: {
                text: ""
            },
            tooltip: {
                trigger: 'axis'
            },
            toolbox : {
                show : true,
                feature : {
                    mark : {
                        show : true
                    },
                    dataView : {
                        show : true,
                        readOnly : false
                    },
                    magicType : {
                        show : true,
                        type : [ 'line', 'bar' ]
                    },
                    restore : {
                        show : true
                    },
                    saveAsImage : {
                        show : true
                    }
                }
            },
            calculable: true,
            xAxis: [
            {
                type: 'category',
                data: [],
            }
        ],
            yAxis: [
            {
                type: 'value',
                splitArea: { show: true },
                max: 10,
                axisLabel: {
                    show: true,
                    formatter: '{value} /10'
                }
            }
        ],
            series: [
            {
                name: '数量',
                type: 'bar',
                barWidth: 30,
                },
                data: []
            }
            ]
        });
        getChartData2();//调用ajax,求情数据
        function getChartData2() {
            //通过Ajax获取数据
            $.ajax({
                    type : "post",
                    async : false, //同步执行
                    url : "${pageContext.request.contextPath}/order/login/pie_data.do",
                    dataType : "json", //返回数据形式为json
                    success : function(result) {
                        if (result) {
                            //options2.legend.data = ["数量"];
                        option.xAxis[0].data = result[0].legend;
                        option.series[0].data = result[0].valueList;
                        //重新定义option,并赋值
                        myChart2.hideLoading();
                        myChart2.setOption(option);
                        }
                    },
                    error : function(errorMsg) {
                        alert("不好意思,求数据失败啦!");
                        myChart2.hideLoading();
                    }
                });
            }
    }
script>