这个例子是用来查看两个信号的相似性,可以针对不同的长度,不同的采样频率的两个信号。
Step1.
加载两个不同采样频率的数据。
% Load data
load relatedsig.mat;

figure
ax(1) = subplot(311);
plot((0:numel(T1)-1)/Fs1,T1,'k');
ylabel('Template 1');
grid on
ax(2) = subplot(312);
plot((0:numel(T2)-1)/Fs2,T2,'r');
ylabel('Template 2');
grid on
ax(3) = subplot(313);
plot((0:numel(S)-1)/Fs,S);
ylabel('Signal');
grid on
xlabel('Time (secs)');
linkaxes(ax(1:3),'x')
axis([0 1.61 -4 4])
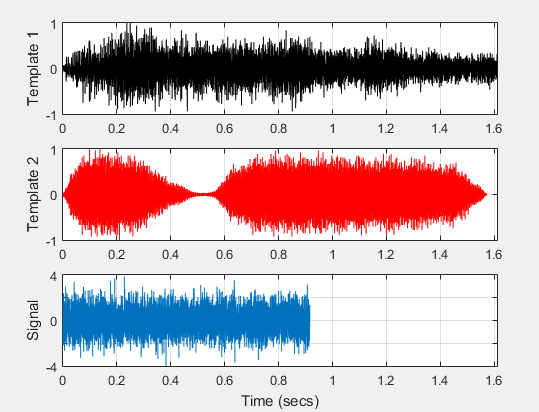
信号如下
信号1和信号2为模板信号,信号3为带搜寻的信号,三个信号的频率如下
对于不同长度的信号无法执行差分,但是可以通过提取公共部分实现。而互相关则对长度没有要求,但需要保证是要有一致的采样频率。所以可以重采样到一个低频率上, resample函数会施加一个抗锯齿的FIR滤波器到信号上。
[P1,Q1] = rat(Fs/Fs1);          % Rational fraction approximation
[P2,Q2] = rat(Fs/Fs2);          % Rational fraction approximation
T1 = resample(T1,P1,Q1);        % Change sampling rate by rational factor
T2 = resample(T2,P2,Q2);        % Change sampling rate by rational factor
Step2.
寻找信号。
把信号S分别和信号T1,T2取互相关。
[C1,lag1] = xcorr(T1,S);
[C2,lag2] = xcorr(T2,S);

figure
ax(1) = subplot(211);
plot(lag1/Fs,C1,'k');
ylabel('Amplitude');
grid on
title('Cross-correlation between Template 1 and Signal')
ax(2) = subplot(212);
plot(lag2/Fs,C2,'r');
ylabel('Amplitude');
grid on
title('Cross-correlation between Template 2 and Signal')
xlabel('Time(secs)');
axis(ax(1:2),[-1.5 1.5 -700 700 ])
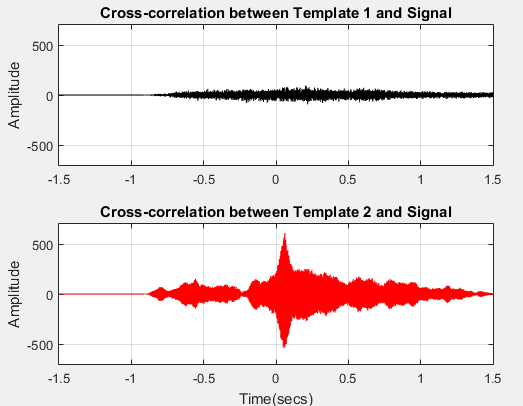
如下
从图上看出,目标信号和T1信号弱相关,但可在T2信号中找到,执行如下指令
可知信号峰值在61ms
Step3.
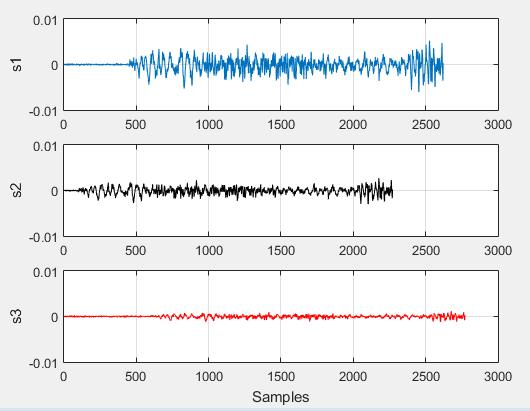
测量信号间的延迟,并对齐
figure,
ax(1) = subplot(311);
plot(s1);
ylabel('s1');
grid on
ax(2) = subplot(312);
plot(s2,'k');
ylabel('s2');
grid on
ax(3) = subplot(313);
plot(s3,'r');
ylabel('s3');
grid on
xlabel('Samples')
linkaxes(ax,'xy')
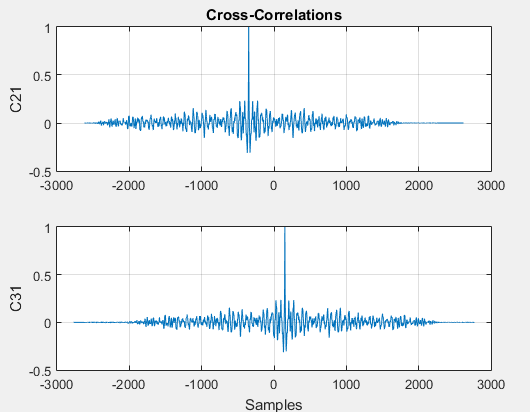
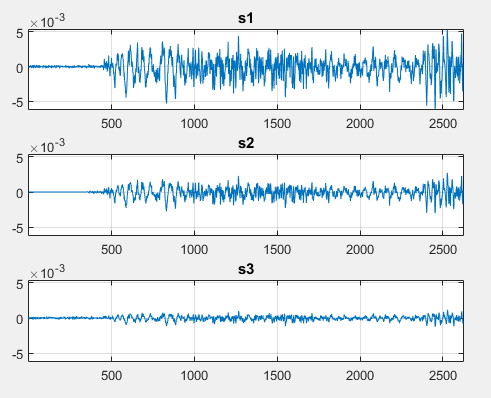
对S1和S2,S1和S3取互相关,则互相关的最大值的点可以表明时间的延迟或滞后
[C21,lag1] = xcorr(s2,s1);
[C31,lag2] = xcorr(s3,s1);

figure
subplot(211);
plot(lag1,C21/max(C21));
ylabel('C21');
grid on
title('Cross-Correlations')
subplot(212);
plot(lag2,C31/max(C31));
ylabel('C31');
grid on
xlabel('Samples')

[~,I1] = max(abs(C21));     % Find the index of the highest peak
[~,I2] = max(abs(C31));     % Find the index of the highest peak
t21 = lag1(I1)              % Time difference between the signals s2,s1
t31 = lag2(I2)              % Time difference between the signals s3,s1
t21表明S2滞后S1 350ms, t31表明 S3超前S1 150ms,根据计算结果对其信号如下
s2 = [zeros(abs(t21),1);s2];
s3 = s3(t31:end);

figure
ax(1) = subplot(311);
plot(s1);
grid on;
title('s1');
axis tight
ax(2) = subplot(312);
plot(s2);
grid on;
title('s2');
axis tight
ax(3) = subplot(313);
plot(s3);
grid on;
title('s3');
axis tight
linkaxes(ax,'xy')
Step4.
比较信号的频域
Fs = FsSig;         % Sampling Rate

[P1,f1] = periodogram(sig1,[],[],Fs,'power');
[P2,f2] = periodogram(sig2,[],[],Fs,'power');

figure
t = (0:numel(sig1)-1)/Fs;
subplot(221);
plot(t,sig1,'k');
ylabel('s1');
grid on
title('Time Series')
subplot(223);
plot(t,sig2);
ylabel('s2');
grid on
xlabel('Time (secs)')
subplot(222);
plot(f1,P1,'k');
ylabel('P1');
grid on;
axis tight
title('Power Spectrum')
subplot(224);
plot(f2,P2);
ylabel('P2');
grid on;
axis tight
xlabel('Frequency (Hz)')
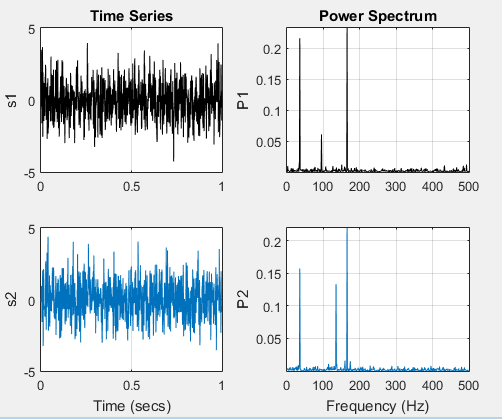
mscohere 函数可以用来比较两个信号的谱特性。
[Cxy,f] = mscohere(sig1,sig2,[],[],[],Fs);
Pxy     = cpsd(sig1,sig2,[],[],[],Fs);
phase   = -angle(Pxy)/pi*180;
[pks,locs] = findpeaks(Cxy,'MinPeakHeight',0.75);

figure
subplot(211);
plot(f,Cxy);
title('Coherence Estimate');
grid on;
hgca = gca;
hgca.XTick = f(locs);
hgca.YTick = .75;
axis([0 200 0 1])
subplot(212);
plot(f,phase);
title('Cross Spectrum Phase (deg)');
grid on;
hgca = gca;
hgca.XTick = f(locs);
hgca.YTick = round(phase(locs));
xlabel('Frequency (Hz)');
axis([0 200 -180 180])
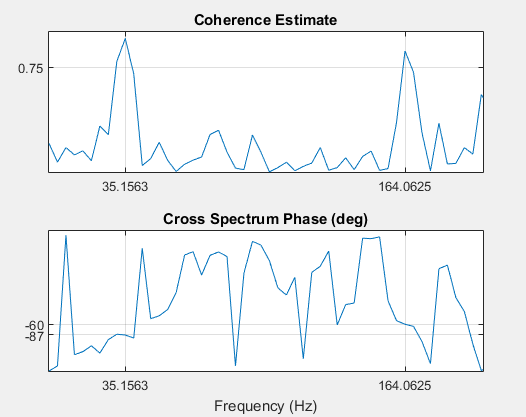
可以看到S1,S2信号在35和165Hz附件有强相关内容
在35hz ,相位落后90,在165Hz,落后90度
Step5.
寻找信号的周期性
load officetemp.mat  % Load Temperature Data
Fs = 1/(60*30);                 % Sample rate is 1 sample every 30 minutes
days = (0:length(temp)-1)/(Fs*60*60*24);

figure
plot(days,temp)
title('Temperature Data')
xlabel('Time (days)');
ylabel('Temperature (Fahrenheit)')
grid on
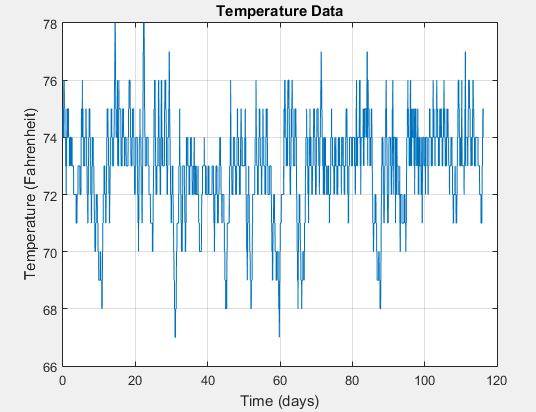
每30分钟记录一次数据,大约16.5周
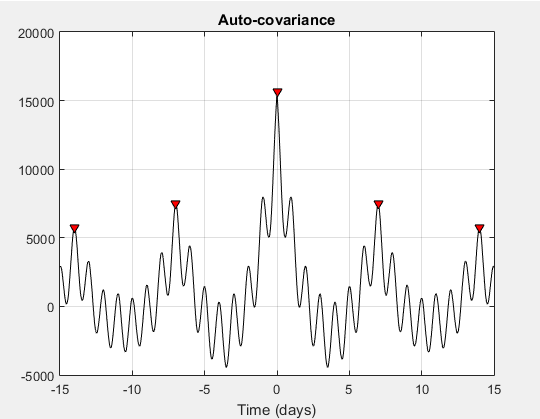
xcov 在计算互相关的时候,会先去除信号的平均值,返回的是互协方差。
maxlags = numel(temp)*0.5;
[xc,lag] = xcov(temp,maxlags);

[~,df] = findpeaks(xc,'MinPeakDistance',5*2*24);
[~,mf] = findpeaks(xc);

figure
plot(lag/(2*24),xc,'k',...
     lag(df)/(2*24),xc(df),'kv','MarkerFaceColor','r')
grid on
xlim([-15 15]);
xlabel('Time (days)')
title('Auto-covariance')
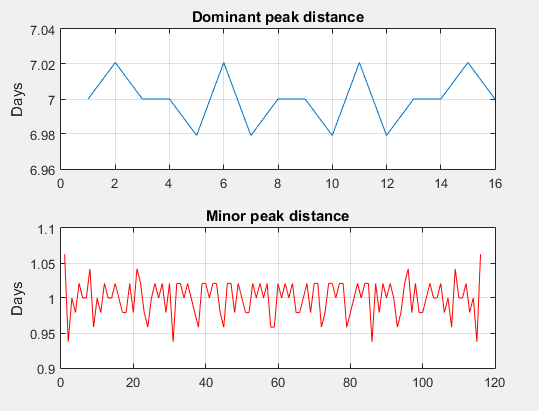
然后看信号峰值的周期性
cycle1 = diff(df)/(2*24);
cycle2 = diff(mf)/(2*24);

subplot(211);
plot(cycle1);
ylabel('Days');
grid on
title('Dominant peak distance')
subplot(212);
plot(cycle2,'r');
ylabel('Days');
grid on
title('Minor peak distance')

mean(cycle1)
mean(cycle2)
得到的周期时间与数据本身是一致的
总结:
学会几个函数的用法
rat,用于有理数近似
resample,重采样
xcorr,取互相关
periodogram,谱密度分析函数
mscohere,谱相干性分析
cpsd,交叉谱密度分析
angle, 取相位
findpeaks, 查找峰值点
xcov,取互协方差
diff, 差分不同采样信号频率的相关分析,重采样,数据平移对齐操作
谱密度相关的分析
信号周期性分析。这个地方为什么要用到互协方差暂时没有搞明白。
