R数据可视化工具 -ployly入门:
plotly开发在线数据分析和可视化工具。 Plotly为个人和协作提供在线图形,分析和统计工具,以及Python,R,MATLAB,Perl,Julia,Arduino和REST的科学图形库。
——引子【wikipedia百科】
Plotly是一个用于创建和共享可视化的且开源免费的制作互动表图的网页应用程序。适用于多个语言 R, Python, Excel,matlab。
常用内工具有:'scatter', 'bar', 'box', 'heatmap', 'histogram', 'histogram2d', 'histogram2dcontour', 'pie', 'contour', 'scatterternary', 'violin', 'scatter3d', 'surface', 'mesh3d', 'cone', 'streamtube', 'scattergeo', 'choropleth', 'scattergl', 'splom', 'pointcloud', 'heatmapgl', 'parcoords', 'scattermapbox', 'sankey', 'table', 'carpet', 'scattercarpet', 'contourcarpet', 'ohlc', 'candlestick', 'scatterpolar', 'scatterpolargl', 'area'
install.packages("plotly")
library(plotly)
下面会介绍几个基础的用法来 熟悉PLOTLY的使用:
1.基础的散点图(Basic Scatterplot)
用mtcars例子来演示,
> head(mtcars)
                   mpg cyl disp  hp drat    wt  qsec vs am gear carb
Mazda RX4         21.0   6  160 110 3.90 2.620 16.46  0  1    4    4
Mazda RX4 Wag     21.0   6  160 110 3.90 2.875 17.02  0  1    4    4
Datsun 710        22.8   4  108  93 3.85 2.320 18.61  1  1    4    1
Hornet 4 Drive    21.4   6  258 110 3.08 3.215 19.44  1  0    3    1
Hornet Sportabout 18.7   8  360 175 3.15 3.440 17.02  0  0    3    2
Valiant           18.1   6  225 105 2.76 3.460 20.22  1  0    3    1
用mpg作y,wt作x来作散点图
> plot_ly(mtcars, x = ~wt, y = ~mpg, type = "scatter")然后用cyl来上色区分散点:
> plot_ly(mtcars, x = ~wt, y = ~mpg, mode="markers",color = as.factor(mtcars$cyl))若区分的变量不是离散变量,而是离散变量,颜色会自动生成连续的方法,如下:
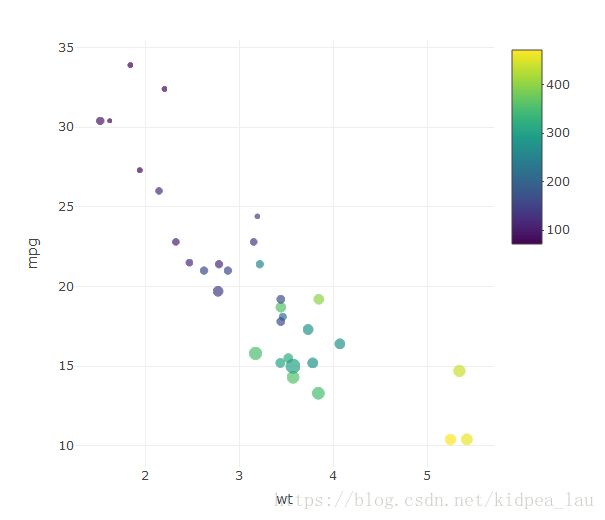
> plot_ly(mtcars, x = ~wt, y = ~mpg, mode="markers",color = mtcars$disp)plotly提供的散点图功能强大丰富,比如再加用点的大小来控制:
> plot_ly(mtcars, x = ~wt, y = ~mpg,
 mode="markers",color = mtcars$disp,size = mtcars$hp)
还有可以非常方便的制定互动的3D图:
>plot_ly(x=mtcars$wt,y=mtcars$mpg,
         z=mtcars$hp,type="scatter3d",
         mode="markers",color=mtcars$temp)
线性图:
线型图也是普通其他包的coding一样,从上面的散点图就可以看出来 ,plotly非常容易入门。下面主要想写一下,作线型图时,把数据整合的步骤:
<具体也可以参照同个blog:R语言数据整理 之 重塑>
>library(dplyr)
> library(tidyr)mtcars1<-mtcars[,1:3]%>%gather(mpg)%>%mutate()琴型图;
> plot_ly(x=mtcars$cyl,y=mtcars$mpg,type = "violin")ggplotly
通常 是ggplot创建了一个图表g后,用ggplotly 使其成为可互动性的图表:
g<-ggplotly(g)


