一文教会你使用R语言和基本统计分析
一文教会你使用R语言和基本统计分析
目录
1.R语言介绍
2.R语言的安装
3.R语言的基本函数使用
4.R语言的基本绘图
4.1 直方图 Histograms
4.2 核密度图 Kernel Density Plots
4.3 点图 Dot Plots
4.4 柱状图 Bar Plots
4.5 饼状图 Pie Charts
4.6 箱型图 Box Plots
4.7 散点图 Scatter Plots
4.8 茎叶图 Stem-and-Leaf display
1.R语言介绍
R是用于统计分析、绘图的语言和操作环境。R是属于GNU系统的一个自由、免费、源代码开放的软件,它是一个用于统计计算和统计制图的优秀工具。
R是统计领域广泛使用的诞生于1980年左右的S语言的一个分支。可以认为R是S语言的一种实现。而S语言是由AT&T贝尔实验室开发的一种用来进行数据探索、统计分析和作图的解释型语言。
最初S语言的实现版本主要是S-PLUS。S-PLUS是一个商业软件,它基于S语言,并由MathSoft公司的统计科学部进一步完善。后来新西兰奥克兰大学的Robert Gentleman和Ross Ihaka及其他志愿人员开发了一个R系统。
由“R开发核心团队”负责开发。R可以看作贝尔实验室(AT&T BellLaboratories)的RickBecker,JohnChambers和AllanWilks开发的S语言的一种实现。
当然,S语言也是S-Plus的基础。所以,两者在程序语法上可以说是几乎一样的,可能只是在函数方面有细微差别,程序十分容易地就能移植到一程序中,而很多一的程序只要稍加修改也能运用于R。
R作为一种统计分析软件,是集统计分析与图形显示于一体的。它可以运行于UNIX,Windows和Macintosh的操作系统上,而且嵌入了一个非常方便实用的帮助系统,相比于其他统计分析软件,R还有以下特点:
- 1.R是自由软件
- 2.R是一种可编程的语言
- 3.所有R的函数和数据集是保存在程序包里面的。
- 4.R具有很强的互动性。
- 5.R是免费的(R is free)。R语言源代码托管在github。
更多关于R语言的介绍和来源,请看以下链接。
R语言的百度百科介绍
R语言的官方介绍
数据可视化——了解下不同图表的使用场景、优劣势
R语言有三大绘图方式,base绘图,lattice绘图,ggplot2绘图 本篇课程主要讲的是base绘图。
2.R语言的安装
R语言和环境是跨平台的,也就是说,你可以在Windows,Linux, Mac OS X平台上运行你的分析程序。(对于计算机小白用户,我多说一句,这三大系统是我们日常生活和工作中使用的计算机系统)
三大系统下载地址
R下载 Mac OS X专用
R下载 Windows专用
Windows的安装包是.exe格式的文件,Mac OS X的安装包是.pkg格式的文件。都是按照正常安装软件的流程一样安装就行。
本博主是以Mac OS 系统来讲解的R,所以如果读者使用Windows系统,也没有关系,因为他们的操作是一样的。
R的软件图标如下:
3.R语言的基本函数使用
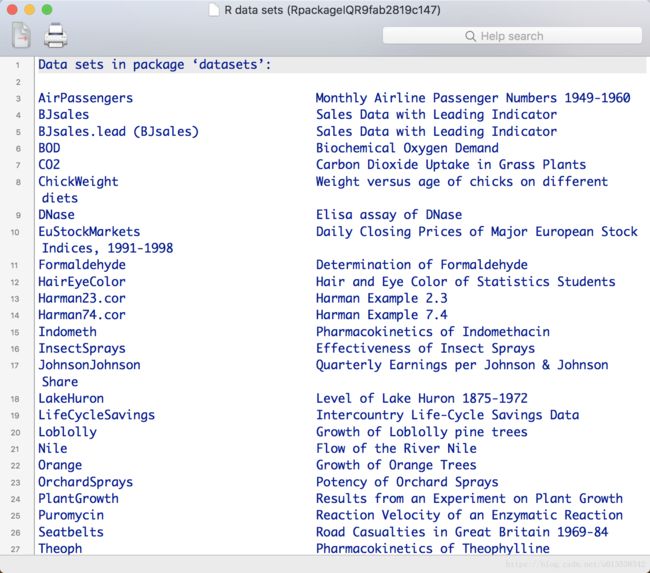
输入 data() 查看R软件自带的所有的数据集
data()
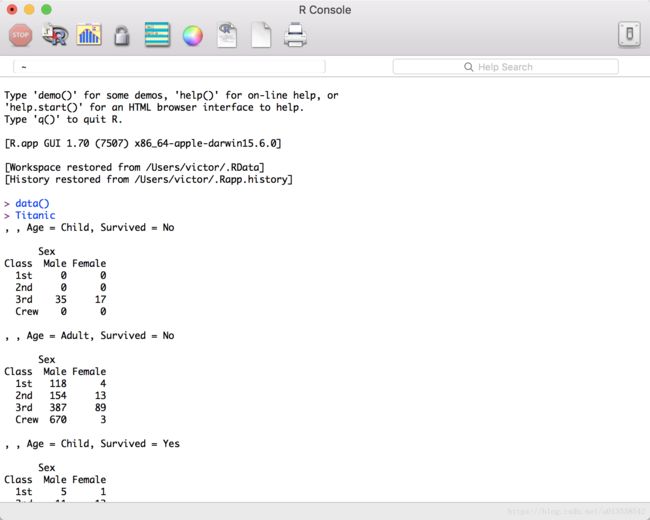
直接输入数据集的名称,可以查看数据,我就拿泰坦尼克号数据集举例 Titanic
Titanic
查看数据集的前6行
head(Titanic)
查看数据集的最后6行
tail(Titanic)
安装 ggplot2 安装包
installed.packages(“ggplot2”)
加载包
library(ggplot2)
c() 函数,我们现在不知道 c() 是做什么的,我们可以这样做
help(c)
第一句话写到 Combine Values into a Vector or List 意思是:c() 函数是将括号里的值转换成一个向量或者列表。
那我们来试试,把 c(1,2,3,4,5,6) 赋值给变量a,然后打印出来
a <- c(1,2,3,4,5,6)
print(a)
输出
[1] 1 2 3 4 5 6
查看变量的长度
length(a)
输出
[1] 6
查看变量的类型
mode(a)
输出
[1] “numeric”
合并两个向量或者列表
> b <- c(11,22,33,44,55,66)  # 创建一个变量b
> rbind(a, b)                # 合并a和b以行的形式
  [,1] [,2] [,3] [,4] [,5] [,6]
a    1    2    3    4    5    6
b   11   22   33   44   55   66
> d = cbind(a, b)                # 合并a和b以列的形式
     a  b
[1,] 1 11
[2,] 2 22
[3,] 3 33
[4,] 4 44
[5,] 5 55
[6,] 6 66

# 查看变量d的类型,返回matrix,就是矩阵
> class(d)
[1] "matrix"

# 再创建一个变量f,f是一个列表
> f <- c(10, 20, 30, 40, 50)
> mean(f)    # 求平均数
[1] 30
> sum(f)     # 求和
[1] 150
> max(f)     # 求最大值
[1] 50
> min(f)     # 求最小值
[1] 10
> sd(f)      # 求标准差
[1] 15.81139
seq() 函数,意思是生成一个向量,从from开始,到to结束,每两个数间的间隔是length,如下:
> seq(2, 10, 2)
[1]  2  4  6  8 10
dnorm() 函数,意思是返回值是正态分布概率密度函数
> x <- c(1,2,3,4,5,6)
> dnorm(a, mean=mean(x), sd=sd(x))
[1] 0.08731988 0.15462560 0.20576217 0.20576217 0.15462560 0.08731988
attach() 和 detach() 就不举例说明了;
attach() 是把数据集里的每一列的值作为一个特殊变量在当前的环境中
detach() 是把数据集的特殊变量从当前的环境中移除
rnorm() 函数产生一系列的随机数,随机数个数,均值和标准差都可以设定。
x <- rnorm(100)           # 产生100个从正态分布的随机数
x <- rnorm(100,3,4)       # 产生100个均值是3,标准差为4的随机数
table() 函数,会返回向量或者矩阵中数值出现的频率
> a <- c(1,2,3,4,4,1,6)
> counts <- table(a)
> print(counts)
a
1 2 3 4 6
2 1 1 2 1
>
查看内存情况
> ls()             # 查看内存中所有的变量
 [1] "a"      "b"      "c"      "d"      "f"      "H"      "lbls"   "M"      "slices" "x1"
> rm(list=ls())    # 移除内存中所有的变量
> ls()             # 再次查看内存中所有的变量
character(0)
4.R语言的基本绘图
4.1 直方图
这次我们拿 mtcars 数据集来举例,这个数据集可以在 data() 中找到,你也可以直接输入进行查看数据集内容
mtcars
# 显示直方图
> hist(mtcars$mpg)

# 为直方图的前12个圆柱填充红色
> hist(mtcars$mpg, breaks=12, col="red")

# 将 `列mtcars` 到 `列mpg` 的值作为一个向量赋值给变量x
> x <- mtcars$mpg

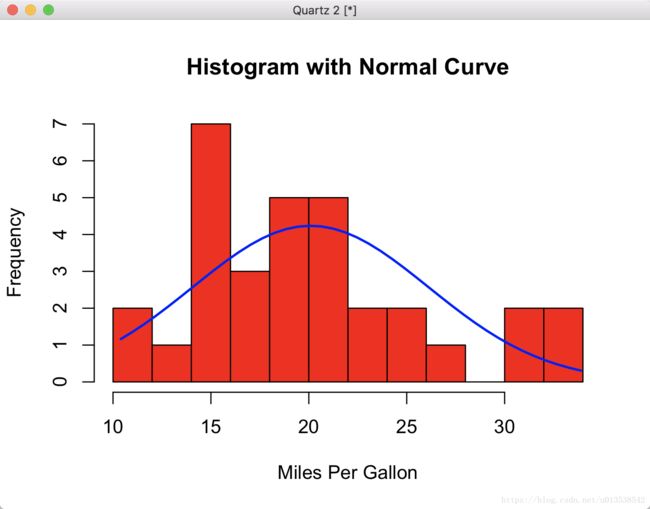
# 给直方图设置属性,前10个圆柱填充红色,并且它的x轴(水平方向)添加一个标签,叫做"Miles Per Gallon";然后再添加一个title,title就是"Histogram with Normal Curve";
> h <- hist(x, breaks=10, col="red", xlab="Miles Per Gallon", main="Histogram with Normal Curve")
图里的y轴上的 Frequency 是概率密度,而不是频率
正态分布的例子
# 先看下变量h的值
> print(h)
$breaks
 [1] 10 12 14 16 18 20 22 24 26 28 30 32 34

$counts
 [1] 2 1 7 3 5 5 2 2 1 0 2 2

$density
 [1] 0.031250 0.015625 0.109375 0.046875 0.078125 0.078125 0.031250 0.031250 0.015625 0.000000 0.031250 0.031250

$mids
 [1] 11 13 15 17 19 21 23 25 27 29 31 33

$xname
[1] "x"

$equidist
[1] TRUE

attr(,"class")
[1] "histogram"
> xfit <-seq(min(x),max(x),length=40)

# 正态分布的值
> yfit <-dnorm(xfit,mean=mean(x),sd=sd(x))
> yfit <- yfit*diff(h$mids[1:2])*length(x)

# 画线
> lines(xfit, yfit, col="blue", lwd=2)
4.2 核密度图
通常情况下 核密度图(Kernel Density Plot)对于正态分布来说更为高效
# 将 从mtcars列到mpg列 的数据读取出来,并打印
> d <- density(mtcars$mpg)
> print(d)

Call:
    density.default(x = mtcars$mpg)

Data: mtcars$mpg (32 obs.);    Bandwidth 'bw' = 2.477

       x               y
 Min.   : 2.97   Min.   :6.481e-05
 1st Qu.:12.56   1st Qu.:5.461e-03
 Median :22.15   Median :1.926e-02
 Mean   :22.15   Mean   :2.604e-02
 3rd Qu.:31.74   3rd Qu.:4.530e-02
 Max.   :41.33   Max.   :6.795e-02

# 显示密度图,和title,title就是main指向的字符串
>plot(d, xlab="Miles Per Gallon", main="Kernel Density Plot")

# 对密度图填充红色背景,蓝色边
> polygon(d, col="red", border="blue")
比较核密度图
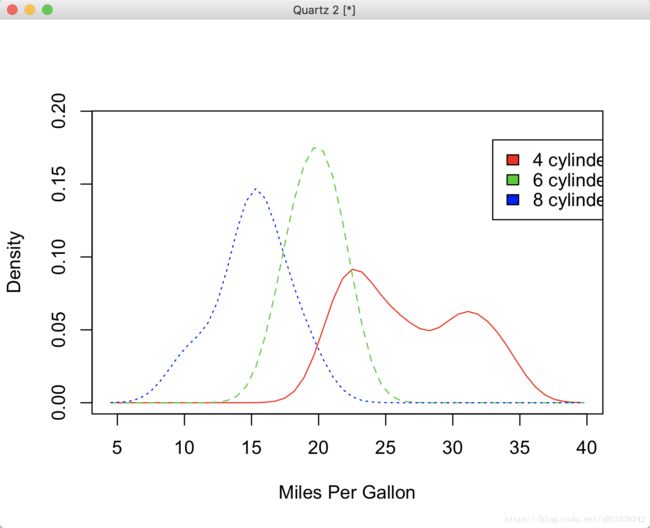
sm.density.compare( ) 函数是 sm 包,允许你在密度图上叠加显示子图;sm.density.compare(x, factor) 这个x是数值向量和因子,也是组变量。
>cyl.f <- factor(cyl, levels=c(4,6,8), labels=c("4 cylinder", "6 cylinder", "8 cylinder"))

# 添加比较密度图
> sm.density.compare(mpg, cyl, xlab="Miles Per Gallon")

# 添加图例
> colfill <- c(2:(2+length(levels(cyl.f))))
> legend(locator(1), levels(cyl.f), fill=colfill)
4.3 点图 Dot Plots
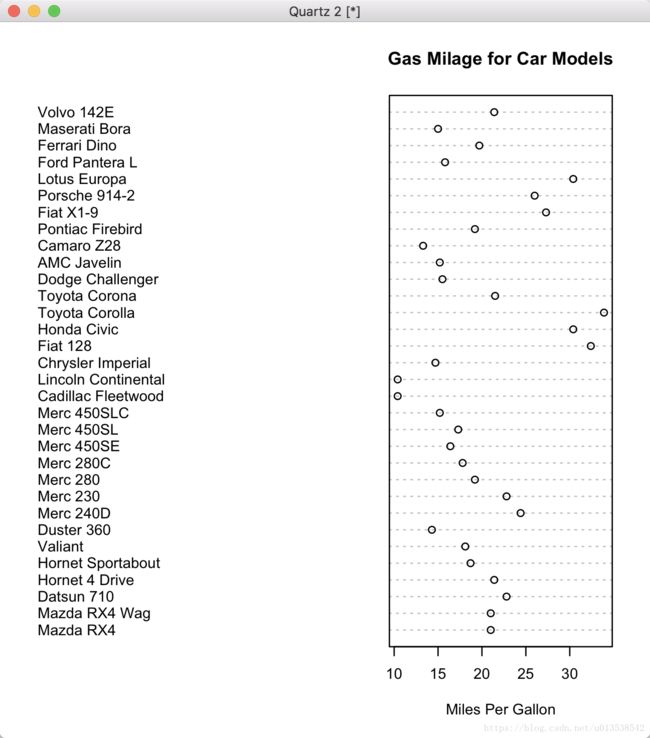
通过 dotchart(x, labels=) 函数来创建一个点图;x是数值向量,labels是向量标签;cex 是控制labels的大小;
dotchart(mtcars$mpg,labels=row.names(mtcars),cex=.7,
    main="Gas Milage for Car Models",
   xlab="Miles Per Gallon")
4.4 柱状图 Bar Plots
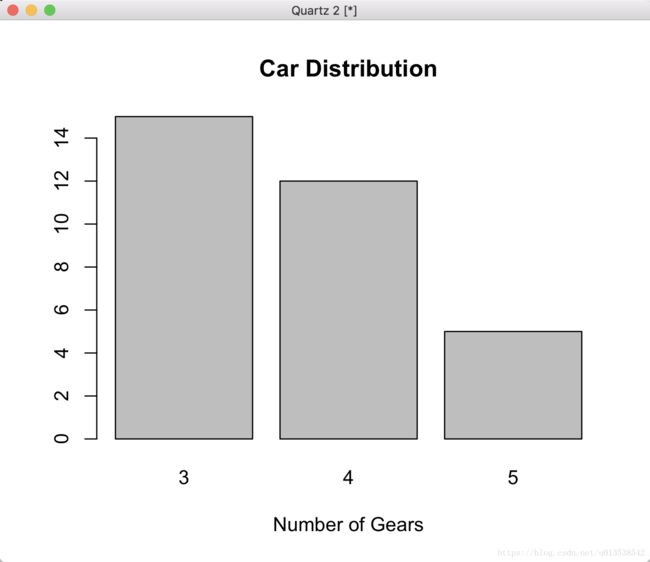
> counts <- table(mtcars$gear)
> barplot(counts, main="Car Distribution", xlab="Number of Gears")水平摆放柱状图,主要参数:horiz=TRUE
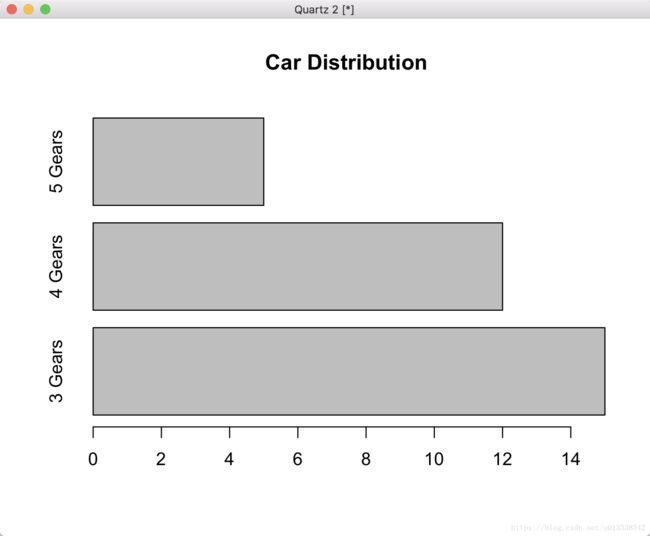
> counts <- table(mtcars$gear)
> barplot(counts, main="Car Distribution", horiz=TRUE, names.arg=c("3 Gears", "4 Gears", "5 Gears"))两个图堆起来的直方图,legend 就是添加图例,col 是添加颜色
> counts <- table(mtcars$vs, mtcars$gear)
> barplot(counts, main="Car Distribution by Gears and VS", xlab="Number of Gears", col=c("darkblue", "red"), legend=rownames(counts))
分组直方图
与上面的主要区别是,设置了参数 beside=TRUE
> counts <- table(mtcars$vs, mtcars$gear)
> barplot(counts, main="Car Distribution by Gears and VS", xlab="Number of Gears", col=c("darkblue", "red"), legend=rownames(counts), beside=TRUE)
4.5 饼状图 Pie Charts
在R文档中饼状图并不被推荐使用,因为它的特性有些限制,R的作者是推荐使用柱状图,点图,因为人们习惯于从长度来判断它的值。
> slices <- c(10, 12, 4, 16, 8)
> lbls <- c("US", "UK", "Australia", "Germany", "France")
> pie(slices, labels=lbls, main="Pie Chart of Countries")
有注释百分比的饼状图
> slices <- c(10, 12, 4, 16, 8)
> lbls <- c("US", "UK", "Australia", "Germany", "France")
> pct <- round(slices / sum(slices) * 100)
> print(pct)
[1] 20 24  8 32 16

> lbls <- paste(lbls, pct)
> lbls <- paste(lbls, "%", sep="")
> pie(slices, labels=lbls, col=rainbow(length(lbls)), main="Pie Chart of Countries")
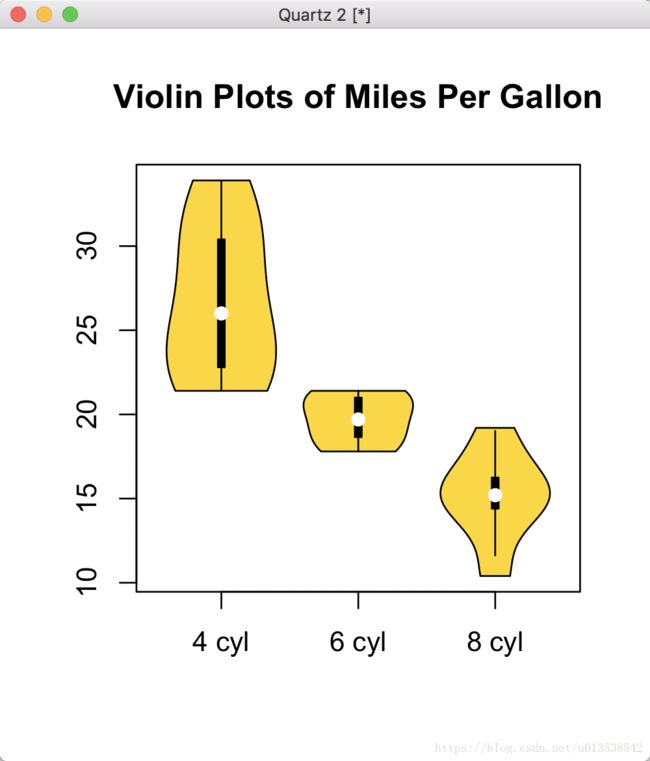
4.6 箱型图 Box Plots
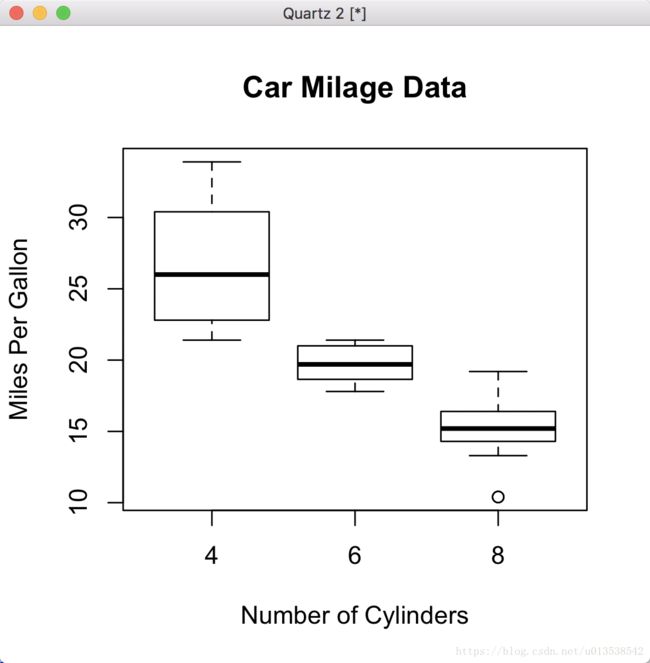
boxplot(mpg~cyl, data=mtcars, main="Car Milage Data", xlab="Number of Cylinders", ylab="Miles Per Gallon")有凹凸的箱型图(Notched Boxplot of Tooth Growth)使用数据集Tooth Growth
> boxplot(len~supp*dose, data=ToothGrowth, notch=TRUE, col=(c("gold", "darkgreen")), main="Tooth Growth", xlab="Suppliment and Dose")小提琴图
# 这里用到了vioplot包,提示不存在,需要安装
> library(vioplot)
Error in library(vioplot) : there is no package called ‘vioplot’

# 安装vioplot
> install.packages("vioplot")
trying URL 'https://mirrors.tongji.edu.cn/CRAN/bin/macosx/el-capitan/contrib/3.4/vioplot_0.2.tgz'
Content type 'application/octet-stream' length 11176 bytes (10 KB)
==================================================
downloaded 10 KB


The downloaded binary packages are in
    /var/folders/nc/9y6wq34s0w31n7l7y4wg7c2m0000gn/T//RtmpSGa8j9/downloaded_packages
> library(vioplot)
> x1 <- mtcars$mpg[mtcars$cyl==4]
> x2 <- mtcars$mpg[mtcars$cyl==6]
> x3 <- mtcars$mpg[mtcars$cyl==8]
> vioplot(x1, x2, x3, names=c("4 cyl", "6 cyl", "8 cyl"), col="gold")
> title("Violin Plots of Miles Per Gallon")
4.7 散点图 Scatter Plots
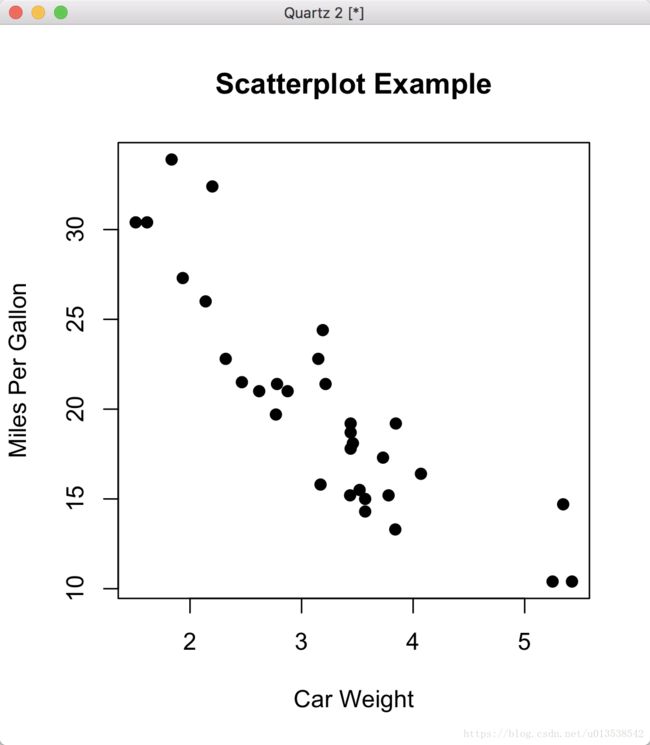
最简单的散点图
> attach(mtcars)
> plot(wt, mpg, main="Scatterplot Example", xlab="Car Weight", ylab="Miles Per Gallon", pch=19)
散点矩阵图
pairs(~mpg+disp+drat+wt, data=mtcars, main="Simple Scatterplot Matrix")3D散点图
> library(scatterplot3d)
> attach(mtcars)
>  s3d <- scatterplot3d(wt, disp, mpg, pch=16, highlight.3d=TRUE, type="h", main="3D Scatterplot")
> fit <- lm(mpg ~ wt+disp)
> s3d$plane3d(fit)
4.8 茎叶图 Stem-and-Leaf display
> x=round(runif(100,min=0,max=100))
> stem(x)

  The decimal point is 1 digit(s) to the right of the |

   0 | 011267889901445556666
   2 | 0114501224567799
   4 | 0244567779011456788
   6 | 01222236670011333456789
   8 | 11333444556777881456
  10 | 0

> stem(x,scale = 1)

  The decimal point is 1 digit(s) to the right of the |

   0 | 011267889901445556666
   2 | 0114501224567799
   4 | 0244567779011456788
   6 | 01222236670011333456789
   8 | 11333444556777881456
  10 | 0

> stem(x,scale = 3)

  The decimal point is 1 digit(s) to the right of the |

   0 | 0112
   0 | 678899
   1 | 0144
   1 | 5556666
   2 | 0114
   2 | 5
   3 | 01224
   3 | 567799
   4 | 0244
   4 | 567779
   5 | 0114
   5 | 56788
   6 | 0122223
   6 | 667
   7 | 00113334
   7 | 56789
   8 | 11333444
   8 | 55677788
   9 | 14
   9 | 56
  10 | 0
另外,扇形图和马赛克图,留给读者自己去百度查吧,也很简单
推荐:
- ggplot2散点图
- ggplot2分布图


