tidyverse数据处理
tidyverse出自于R大神Hadley Wickham之手,他是Rstudio首席科学家,也是ggplot2的作者。tidyverse就是他将自己所写的包整理成了一整套数据处理的方法,包括ggplot2,dplyr,tidyr,readr,purrr,tibble,stringr, forcats。tidyverse主要的经常用的函数工具:
1.管道符%>%
> iris %>% head(,3)
  Sepal.Length Sepal.Width Petal.Length Petal.Width Species
1          5.1         3.5          1.4         0.2  setosa
2          4.9         3.0          1.4         0.2  setosa
3          4.7         3.2          1.3         0.2  setosa
4          4.6         3.1          1.5         0.2  setosa
5          5.0         3.6          1.4         0.2  setosa
6          5.4         3.9          1.7         0.4  setosa
2.filter
> filter(iris,Species == "virginica")
   Sepal.Length Sepal.Width Petal.Length Petal.Width   Species
1           6.3         3.3          6.0         2.5 virginica
2           5.8         2.7          5.1         1.9 virginica
3           7.1         3.0          5.9         2.1 virginica
4           6.3         2.9          5.6         1.8 virginica
5           6.5         3.0          5.8         2.2 virginica
6           7.6         3.0          6.6         2.1 virginica
7           4.9         2.5          4.5         1.7 virginica
8           7.3         2.9          6.3         1.8 virginica
... ...
3.select
> select(iris, Petal.Length,Petal.Width,Species)
    Petal.Length Petal.Width    Species
1            1.4         0.2     setosa
2            1.4         0.2     setosa
3            1.3         0.2     setosa
4            1.5         0.2     setosa
5            1.4         0.2     setosa
6            1.7         0.4     setosa
7            1.4         0.3     setosa
8            1.5         0.2     setosa
... ...

> select(iris,-Sepal.Length,-Sepal.Width)
    Petal.Length Petal.Width    Species
1            1.4         0.2     setosa
2            1.4         0.2     setosa
3            1.3         0.2     setosa
4            1.5         0.2     setosa
5            1.4         0.2     setosa
6            1.7         0.4     setosa
7            1.4         0.3     setosa
8            1.5         0.2     setosa
4.arrange
> arrange(iris,Sepal.Length)
    Sepal.Length Sepal.Width Petal.Length Petal.Width    Species
1            4.3         3.0          1.1         0.1     setosa
2            4.4         2.9          1.4         0.2     setosa
3            4.4         3.0          1.3         0.2     setosa
4            4.4         3.2          1.3         0.2     setosa
5            4.5         2.3          1.3         0.3     setosa
6            4.6         3.1          1.5         0.2     setosa
7            4.6         3.4          1.4         0.3     setosa
8            4.6         3.6          1.0         0.2     setosa
... ...

> arrange(iris,desc(Sepal.Length))
    Sepal.Length Sepal.Width Petal.Length Petal.Width    Species
1            7.9         3.8          6.4         2.0  virginica
2            7.7         3.8          6.7         2.2  virginica
3            7.7         2.6          6.9         2.3  virginica
4            7.7         2.8          6.7         2.0  virginica
5            7.7         3.0          6.1         2.3  virginica
6            7.6         3.0          6.6         2.1  virginica
7            7.4         2.8          6.1         1.9  virginica
8            7.3         2.9          6.3         1.8  virginica
5.mutate
> mutate(iris,Spepal.Area = Sepal.Length*Sepal.Width)
    Sepal.Length Sepal.Width Petal.Length Petal.Width    Species Spepal.Area
1            5.1         3.5          1.4         0.2     setosa       17.85
2            4.9         3.0          1.4         0.2     setosa       14.70
3            4.7         3.2          1.3         0.2     setosa       15.04
4            4.6         3.1          1.5         0.2     setosa       14.26
5            5.0         3.6          1.4         0.2     setosa       18.00
6            5.4         3.9          1.7         0.4     setosa       21.06
7            4.6         3.4          1.4         0.3     setosa       15.64
8            5.0         3.4          1.5         0.2     setosa       17.00
... ...
6.summarise
> summarise(iris,count=n(),mean=mean(Sepal.Length))
  count     mean
1   150 5.843333
7.group_by,通常跟summarise一起使用
> group_by(iris,Species) %>% summarise(n(),mean=mean(Sepal.Length),max=max(Sepal.Width))
# A tibble: 3 x 4
  Species    `n()`  mean   max

1 setosa        50  5.01   4.4
2 versicolor    50  5.94   3.4
3 virginica     50  6.59   3.8
8.unite
> unite(iris,Sepal.Area,Sepal.Length,Sepal.Width,sep=" x ",remove=FALSE)
    Sepal.Area Sepal.Length Sepal.Width Petal.Length Petal.Width    Species
1    5.1 x 3.5          5.1         3.5          1.4         0.2     setosa
2      4.9 x 3          4.9         3.0          1.4         0.2     setosa
3    4.7 x 3.2          4.7         3.2          1.3         0.2     setosa
4    4.6 x 3.1          4.6         3.1          1.5         0.2     setosa
5      5 x 3.6          5.0         3.6          1.4         0.2     setosa
6    5.4 x 3.9          5.4         3.9          1.7         0.4     setosa
... ...

iris_ <- unite(iris,Sepal.Area,Sepal.Length,Sepal.Width,sep=" x ",remove=FALSE)
9.seperate
> separate(iris_,Sepal.Area,c("Length_","Width_"),sep=" x ",remove=TRUE)
    Length_ Width_ Sepal.Length Sepal.Width Petal.Length Petal.Width    Species
1       5.1    3.5          5.1         3.5          1.4         0.2     setosa
2       4.9      3          4.9         3.0          1.4         0.2     setosa
3       4.7    3.2          4.7         3.2          1.3         0.2     setosa
4       4.6    3.1          4.6         3.1          1.5         0.2     setosa
5         5    3.6          5.0         3.6          1.4         0.2     setosa
6       5.4    3.9          5.4         3.9          1.7         0.4     setosa
7       4.6    3.4          4.6         3.4          1.4         0.3     setosa
... ...
10.gather (ggplot2画图的时候经常会用到)
> gather(iris,measurement,value,Sepal.Length:Petal.Width)
       Species   mesurement value
1       setosa Sepal.Length   5.1
2       setosa Sepal.Length   4.9
3       setosa Sepal.Length   4.7
4       setosa Sepal.Length   4.6
5       setosa Sepal.Length   5.0
6       setosa Sepal.Length   5.4
7       setosa Sepal.Length   4.6
8       setosa Sepal.Length   5.0
9       setosa Sepal.Length   4.4
10      setosa Sepal.Length   4.9
11      setosa Sepal.Length   5.4
12      setosa Sepal.Length   4.8
13      setosa Sepal.Length   4.8
14      setosa Sepal.Length   4.3
15      setosa Sepal.Length   5.8
16      setosa Sepal.Length   5.7
17      setosa Sepal.Length   5.4
... ...

> iris_ <- gather(iris,measurement,value,Sepal.Length:Petal.Width)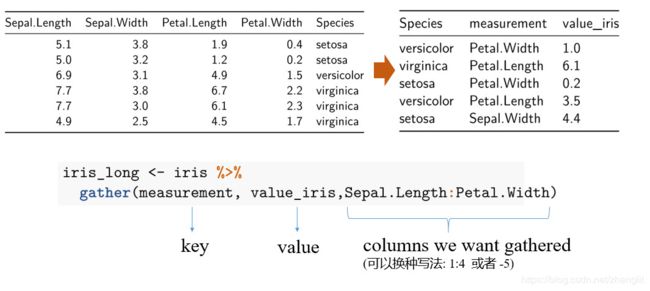
11.spread
> spread(iris_,measurement,value)
错误: Each row of output must be identified by a unique combination of keys.
Keys are shared for 600 rows:
* 301, 302, 303, 304, 305, 306, 307, 308, 309, 310, 311, 312, 313, 314, 315, 316, 317, 318, 319, 320, 321, 322, 323, 324, 325, 326, 327, 328, 329, 330, 331, 332, 333, 334, 335, 336, 337, 338, 339, 340, 341, 342, 343, 344, 345, 346, 347, 348, 349, 350
* 351, 352, 353, 354, 355, 356, 357, 358, 359, 360, 361, 362, 363, 364, 365, 366, 367, 368, 369, 370, 371, 372, 373, 374, 375, 376, 377, 378, 379, 380, 381, 382, 383, 384, 385, 386, 387, 388, 389, 390, 391, 392, 393, 394, 395, 396, 397, 398, 399, 400
* 401, 402, 403, 404, 405, 406, 407, 408, 409, 410, 411, 412, 413, 414, 415, 416, 417, 418, 419, 420, 421, 422, 423, 424, 425, 426, 427, 428, 429, 430, 431, 432, 433, 434, 435, 436, 437, 438, 439, 440, 441, 442, 443, 444, 445, 446, 447, 448, 449, 450
* 451, 452, 453, 454, 455, 456, 457, 458, 459, 460, 461, 462, 463, 464, 465, 466, 467, 468, 469, 470, 471, 472, 473, 474, 475, 476, 477, 47
> length(iris_$value)
[1] 600
> iris_$id <- 1:600
> spread(iris_,measurement,value)
       Species  id Petal.Length Petal.Width Sepal.Length Sepal.Width
1       setosa   1           NA          NA          5.1          NA
2       setosa   2           NA          NA          4.9          NA
3       setosa   3           NA          NA          4.7          NA
4       setosa   4           NA          NA          4.6          NA
5       setosa   5           NA          NA          5.0          NA
6       setosa   6           NA          NA          5.4          NA
7       setosa   7           NA          NA          4.6          NA
8       setosa   8           NA          NA          5.0          NA
9       setosa   9           NA          NA          4.4          NA
... ...
参考两篇文章:
http://www.mamicode.com/info-detail-2216961.html
https://mp.weixin.qq.com/s/-NIQ1DhXTHGY2xpanwbf9w