Jupyter notebook与Matplotlib快速使用指南
Jupyter Notebook基础
Jupyter Notebook服务启动与停止
- 打开工作目录,按住shift键的同时点击鼠标右键,选择‘在此处打开命令行’;在命令行中键入命令jupyter notebook,之后服务就会启动,并在电脑默认浏览器里打开首页并显示当前工作目录的文件
- 在命令提示符窗口使用Control-C停止服务,双击则跳过确认
Jupyter Notebook常用快捷键
模式切换:
- 当前cell侧边为蓝色时,表示此时为命令模式,按Enter切换为编辑模式
- 当前cell侧边为绿色时,表示此时为编辑模式,按Esc切换为命令模式
命令模式快捷键:
- Ctrl-Enter:运行当前cell
- Shift-Enter:运行当前cell并跳转到下一cell,如果下方没有cell则会新建一个空的cell
- Alt-Enter:运行当前cell并在下方新建cell
- A:在当前cell上方新建cell
- B:在当前cell下方新建cell
- M:把当前cell转换为markdown形式
- Y:把当前cell转换为代码形式
- H:显示快捷键帮助
- F:查找和替换
- P:打开命令面板
- 1~6:把当前cell内容设置为标题1~6格式
- Shift+上下键:按住Shift进行上下键操作可复选多个cell
- X/C/Shift-V/V:剪切/复制/上方粘贴/下方粘贴
- 双击D:删除当前cell
- Z:撤销删除
- S:保存notebook
- L:为当前cell的代码添加行编号
- Shift-L:为所有cell的代码添加行编号
- Shift-M:合并所选cell或合并当前cell和下方的cell
- 双击I:停止kernel
- 双击0:重启kernel
编辑模式快捷键:
- Tab:代码补全
- Ctrl-A:全选
- Ctrl-Z:撤销
- Ctrl-Home:将光标移至cell最前端
- Ctrl-End:将光标移至cell末端
Jupyter Notebook中的魔法命令
- %run 运行自己编写的文件,运行过后函数可以直接使用
%run ./myccript/hello.py 在之后的cell中可以直接调用该.py文件中的函数
- %timeit 自动测试程序执行的时间
%timeit L = [i**2 for i in range(1000)] # 只能测试单行代码
输出为:478 µs ± 34.5 µs per loop (mean ± std. dev. of 7 runs, 1000 loops each)
- %%timeit # 可以测试一个代码块执行的时间
L = []
for n in range(1000):
L.append(n**2)
输出为:557 µs ± 31.4 µs per loop (mean ± std. dev. of 7 runs, 1000 loops each)- %time 只执行一次 (1 loop)
- %%time 只执行一次,测试一个代码块的运行时间
其他魔法命令
- % lsmagic
- %run? 魔法命令+?可以查看当前魔法命令的文档
Jupyter自动计算每个cell的运行时间:使用jupyter时,经常会想知道这个cell执行了多少时间。每次单独写计时又特别麻烦。gluon介绍了一种方便快捷的方案,通过jupyter_contrib_nbextensions中的计时插件来实现。
pip install jupyter_contrib_nbextensions
jupyter contrib nbextension install --user
jupyter nbextension enable execute_time/ExecuteTime
matplotlib 基础
import matplotlib as mpl
import matplotlib.pyplot as plt
import numpy as np
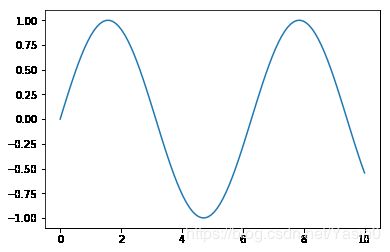
x = np.linspace(0, 10, 100) # 从0-10切分100段 每个点作为元素,从而产生一个向量
y = np.sin(x)

plt.plot(x, y)
plt.show()
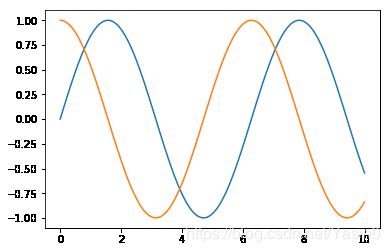
siny = y.copy()
cosy = np.cos(x)
plt.plot(x, siny)
plt.plot(x, cosy) # 在一个图像绘制两条曲线
plt.show() # 将之前绘制的两条曲线一起显示出来
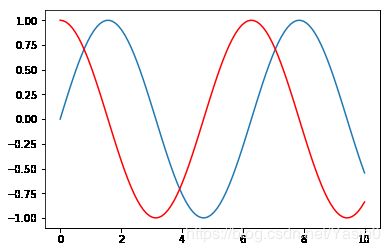
plt.plot(x, siny)
plt.plot(x, cosy, color="red") # 可以指定颜色
plt.show()
关于color参数:https://matplotlib.org/2.0.2/api/colors_api.html
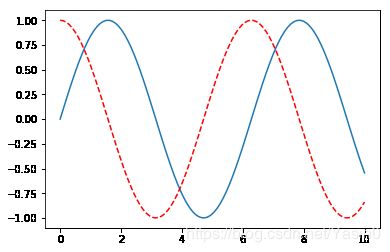
plt.plot(x, siny)
plt.plot(x, cosy, color="red", linestyle="--") # 指定线条的样式
plt.show()
关于linestyle参数:https://matplotlib.org/devdocs/gallery/lines_bars_and_markers/line_styles_reference.html
plt.plot(x, siny)
plt.plot(x, cosy, color="red", linestyle="--")
plt.xlim(-5, 15) # 指定X轴坐标的范围
plt.ylim(0, 1) # 指定Y轴坐标的范围
plt.show()
plt.plot(x, siny)
plt.plot(x, cosy, color="red", linestyle="--")
plt.axis([-1, 11, -2, 2]) # 对两个轴的范围一起进行调整,顺序为XY
plt.show()plt.plot(x, siny)
plt.plot(x, cosy, color="red", linestyle="--")
plt.xlabel("x axis") # 指定X轴的标签
plt.ylabel("y value") # 指定Y轴的标签
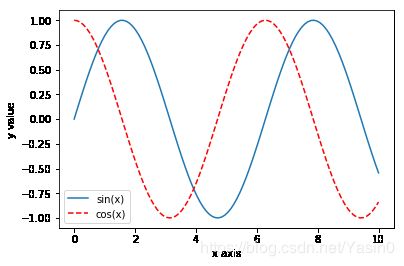
plt.show()plt.plot(x, siny, label="sin(x)") # 图示标签
plt.plot(x, cosy, color="red", linestyle="--", label="cos(x)") # 图示标签
plt.xlabel("x axis")
plt.ylabel("y value")
plt.legend() # 加上图示
plt.show()plt.plot(x, siny, label="sin(x)")
plt.plot(x, cosy, color="red", linestyle="--", label="cos(x)")
plt.xlabel("x axis")
plt.ylabel("y value")
plt.legend()
plt.title("Welcome to matplotlib world!") # 加图的标题
plt.show() # 将之前所有的操作进行统一显示Scatter Plot(散点图)
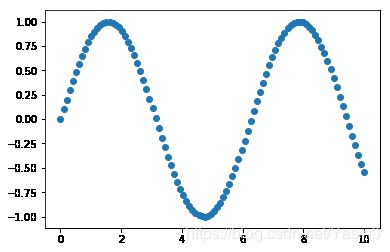
plt.scatter(x, siny) # 散点图   plt.plot绘制的是折线图
plt.show()
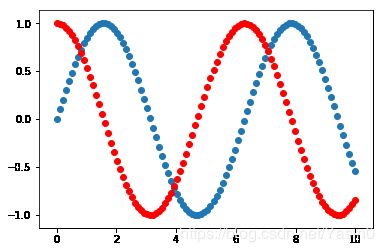
plt.scatter(x, siny) # 一般将XY作为特征 将颜色作为标签
plt.scatter(x, cosy, color="red")
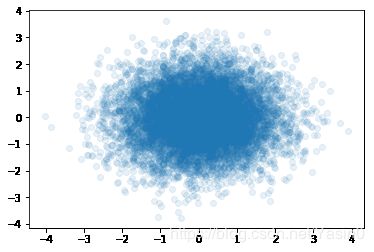
plt.show()x = np.random.normal(0, 1, 10000) # 产生均值为0 方差为1的10000个数
y = np.random.normal(0, 1, 10000)
plt.scatter(x, y, alpha=0.1) # alpha代表不透明度 0代表完全透明,1代表完全不透明
plt.show()读取数据和简单的数据探索
import numpy as np
import matplotlib as mpl
import matplotlib.pyplot as plt
from sklearn import datasets
iris = datasets.load_iris()
iris.keys()
# 返回:dict_keys(['data', 'target', 'target_names', 'DESCR', 'feature_names']) iris可用的属性和方法
iris.DESCR
# 返回iris数据集的描述情况
iris.data.shape
# 返回:(150, 4) 共150个样本,每个样本4个属性
iris.feature_names
'''返回:
['sepal length (cm)',
'sepal width (cm)',
'petal length (cm)',
'petal width (cm)']
'''
iris.target
'''返回:
array([0, 0, 0, 0, 0, 0, 0, 0, 0, 0, 0, 0, 0, 0, 0, 0, 0, 0, 0, 0, 0, 0, 0,
0, 0, 0, 0, 0, 0, 0, 0, 0, 0, 0, 0, 0, 0, 0, 0, 0, 0, 0, 0, 0, 0, 0,
0, 0, 0, 0, 1, 1, 1, 1, 1, 1, 1, 1, 1, 1, 1, 1, 1, 1, 1, 1, 1, 1, 1,
1, 1, 1, 1, 1, 1, 1, 1, 1, 1, 1, 1, 1, 1, 1, 1, 1, 1, 1, 1, 1, 1, 1,
1, 1, 1, 1, 1, 1, 1, 1, 2, 2, 2, 2, 2, 2, 2, 2, 2, 2, 2, 2, 2, 2, 2,
2, 2, 2, 2, 2, 2, 2, 2, 2, 2, 2, 2, 2, 2, 2, 2, 2, 2, 2, 2, 2, 2, 2,
2, 2, 2, 2, 2, 2, 2, 2, 2, 2, 2, 2])
'''
iris.target.shape
# 返回:(150,)
iris.target_names
# 返回:array(['setosa', 'versicolor', 'virginica'], dtype='y = iris.target
# 将三个类别的样本分别进行绘制,并为每个类别的样本赋予不同的颜色
plt.scatter(X[y==0,0], X[y==0,1], color="red") # 选出标签为0的行第1列为横坐标,第2列为纵坐标
plt.scatter(X[y==1,0], X[y==1,1], color="blue")
plt.scatter(X[y==2,0], X[y==2,1], color="green")
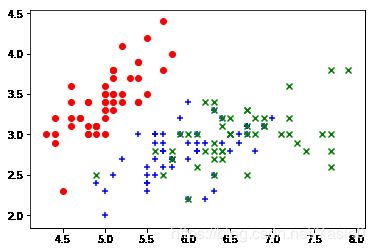
plt.show()plt.scatter(X[y==0,0], X[y==0,1], color="red", marker="o") # 设置散点图 点的样式
plt.scatter(X[y==1,0], X[y==1,1], color="blue", marker="+")
plt.scatter(X[y==2,0], X[y==2,1], color="green", marker="x")
plt.show()关于marker参数:http://matplotlib.org/1.4.2/api/markers_api.html
X = iris.data[:,2:] # 取所有行 34列进行绘图
plt.scatter(X[y==0,0], X[y==0,1], color="red", marker="o")
plt.scatter(X[y==1,0], X[y==1,1], color="blue", marker="+")
plt.scatter(X[y==2,0], X[y==2,1], color="green", marker="x")
plt.show()
