分类以及拟合的python代码实现
import numpy as np
from matplotlib import pyplot as plt

import matplotlib
matplotlib.rcParams['font.sans-serif'] = ['SimHei']
matplotlib.rcParams['font.family']='sans-serif'
matplotlib.rcParams['axes.unicode_minus'] = False
In [2]:
def loadDataSet(filename):
    X = []
    Y = []
    with open(filename, 'rb') as f:
        for idx, line in enumerate(f):
            line = line.decode('utf-8').strip()
            if not line:
                continue

            eles = line.split()

            if idx == 0:
                numFea = len(eles)

            eles = map(float, eles)

            X.append(eles[:-1])
            Y.append([eles[-1]])
    return np.array(X), np.array(Y)
In [3]:
def sigmoid(z):
    return 1.0 / (1.0 + np.exp(-z))
In [5]:
def J(theta, X, y, theLambda=0):
    m, n = X.shape
    h = sigmoid(np.dot(X, theta))
    J = (-1.0/m)*(np.log(h).T.dot(y)+np.log(1-h).T.dot(1-y)) + (theLambda/(2.0*m))*np.sum(np.square(theta[1:]))

    if np.isnan(J[0]):
        return np.inf

    return J.flatten()[0]
In [6]:
def gradient(X, y, options):
    """
    options.alpha 学习率
    options.theLambda 正则参数λ
    options.maxLoop 最大迭代轮次
    options.epsilon 判断收敛的阈值
    options.method
        - 'sgd' 随机梯度下降
        - 'bgd' 批量梯度下降
    """
    m, n = X.shape

    # 初始化模型参数,n个特征对应n和参数
    theta = np.zeros((n,1))

    error = J(theta, X, y) # 当前误差
    errors = [error,] # 迭代中的每一轮的误差
    thetas = [theta,]

    alpha = options.get('alpha', 0.01)
    epsilon = options.get('epsilon', 0.00001)
    maxLoop = options.get('maxLoop', 1000)
    theLambda = float(options.get('theLambda', 0)) # 后面有 theLambda/m 的计算,如果这里不转成float,后面这个就全是0
    method = options.get('method', 'bgd')

    def _sgd(theta):
        count = 0 # 迭代轮次
        converged = False
        while count < maxLoop:
            if converged:
                break
            # 随机梯度下降,每一个样本都更新
            for i in range(m):
                h = sigmoid(np.dot(X[i].reshape((1,n)), theta))

                theta = theta - alpha*((1.0/m)*X[i].reshape((n,1)) * (h - y[i]) + (theLambda/m)*np.r_[[[0]], theta[1:]])

                thetas.append(theta)
                error = J(theta, X, y, theLambda)
                errors.append(error)
                if abs(errors[-1] - errors[-2]) < epsilon:
                    converged = True
                    break
            count += 1
        return thetas,errors,count

    def _bgd(theta):
        count = 0
        converged = False
        while count < maxLoop:
            if converged:
                break

            h = sigmoid(np.dot(X, theta))

            theta = theta - alpha*((1.0/m)* np.dot(X.T, (h - y)) + (theLambda/m)*np.r_[[[0]], theta[1:]])

            thetas.append(theta)
            error = J(theta, X, y, theLambda)
            errors.append(error)

            count += 1

            if abs(errors[-1] - errors[-2]) < epsilon:
                converged = True
                break

        return thetas, errors, count


    methods = {'sgd': _sgd, 'bgd': _bgd}
    return methods[method](theta)
In [7]:
# 加载数据
ori_X, y = loadDataSet('./data/linear.txt')
m, n = ori_X.shape
X = np.concatenate((np.ones((m,1)), ori_X), axis=1)
In [8]:
options = {
    'alpha': 0.1,
    'epsilon': 0.00000000001,
    'maxLoop': 10000,
    'method':'bgd' # sgd
}
In [9]:
# 训练
thetas, errors, iterationCount = gradient(X, y, options)
In [10]:
errors[-1], errors[-2], iterationCount
Out[10]:
(0.09737831553078125, 0.09737905637441172, 10000)
In [11]:
%matplotlib inline
In [12]:
# 绘制决策边界
for i in range(m):
    x = X[i]
    if y[i] == 1:
        plt.scatter(x[1], x[2], marker='*', color='blue', s=50)
    else:
        plt.scatter(x[1], x[2], marker='o', color='green', s=50)

hSpots = np.linspace(X[:,1].min(), X[:,1].max(), 100)
theta0, theta1, theta2 = thetas[-1]

vSpots = -(theta0+theta1*hSpots)/theta2
plt.plot(hSpots, vSpots, color='red', linewidth=.5)
plt.xlabel(r'$x_1$')
plt.ylabel(r'$x_2$')
Out[12]:
Text(0,0.5,'$x_2$')
/Users/sunkepeng/anaconda2/lib/python2.7/site-packages/matplotlib/font_manager.py:1331: UserWarning: findfont: Font family [u'sans-serif'] not found. Falling back to DejaVu Sans
  (prop.get_family(), self.defaultFamily[fontext]))

In [13]:
# 绘制误差曲线
plt.plot(range(len(errors)), errors)
plt.xlabel(u'迭代次数')
plt.ylabel(u'代价J')
Out[13]:
Text(0,0.5,u'\u4ee3\u4ef7J')

In [14]:
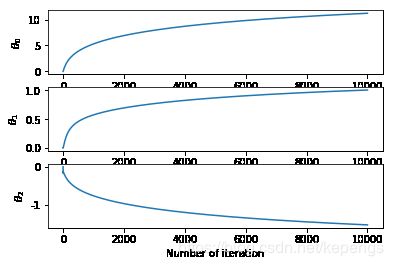
# 绘制参数theta变化
thetasFig, ax = plt.subplots(len(thetas[0]))
thetas = np.asarray(thetas)
for idx, sp in enumerate(ax):
    thetaList = thetas[:, idx]
    sp.plot(range(len(thetaList)), thetaList)
    sp.set_xlabel('Number of iteration')
    sp.set_ylabel(r'$\theta_%d$'%idx)
In [15]:
from sklearn.preprocessing import PolynomialFeatures
# 非线性决策边界
ori_X, y = loadDataSet('./data/non_linear.txt')
m, n = ori_X.shape
X = np.concatenate((np.ones((m,1)), ori_X), axis=1)

poly = PolynomialFeatures(6)
XX = poly.fit_transform(X[:,1:3])
m, n = XX.shape
In [16]:
options = {
    'alpha': 1.0,
    'epsilon': 0.00000001,
    'theLambda': 0,
    'maxLoop': 10000,
    'method': 'bgd'
}
In [17]:
thetas, errors, iterationCount = gradient(XX, y, options)
In [18]:
thetas[-1], errors[-1], iterationCount
Out[18]:
(array([[ 4.15830294],
        [ 2.10551048],
        [ 5.23253682],
        [-5.83414544],
        [-7.67752609],
        [-7.28923819],
        [ 2.46147543],
        [-0.22788302],
        [ 3.2198704 ],
        [-3.09468095],
        [-4.52156975],
        [ 3.9332249 ],
        [-4.08193076],
        [-2.71489978],
        [-6.33761165],
        [-1.79250774],
        [-0.53711734],
        [ 5.72823742],
        [-4.19940451],
        [-4.29890178],
        [ 3.19454695],
        [-5.94924455],
        [ 1.31894157],
        [-0.93549023],
        [ 3.26435671],
        [-4.6439225 ],
        [-4.04001109],
        [ 0.81761338]]), 0.3142660259332875, 10000)
In [19]:
for i in range(m):
    x = X[i]
    if y[i] == 1:
        plt.scatter(x[1], x[2], marker='*', color='blue', s=50)
    else:
        plt.scatter(x[1], x[2], marker='o', color='green', s=50)

# 绘制决策边界
x1Min,x1Max,x2Min,x2Max = X[:, 1].min(), X[:, 1].max(), X[:, 2].min(), X[:, 2].max()
xx1, xx2 = np.meshgrid(np.linspace(x1Min, x1Max), np.linspace(x2Min, x2Max))
h = sigmoid(poly.fit_transform(np.c_[xx1.ravel(), xx2.ravel()]).dot(thetas[-1]))
h = h.reshape(xx1.shape)
plt.contour(xx1, xx2, h, [0.5], colors='red', linewidth=.5)
/Users/sunkepeng/anaconda2/lib/python2.7/site-packages/matplotlib/contour.py:1004: UserWarning: The following kwargs were not used by contour: 'linewidth'
  s)
Out[19]:
In [20]:
for i in range(m):
    x = X[i]
    if y[i] == 1:
        plt.scatter(x[1], x[2], marker='*', color='blue', s=50)
    else:
        plt.scatter(x[1], x[2], marker='o', color='green', s=50)

# 绘制决策边界
x1Min,x1Max,x2Min,x2Max = X[:, 1].min(), X[:, 1].max(), X[:, 2].min(), X[:, 2].max()
xx1, xx2 = np.meshgrid(np.linspace(x1Min, x1Max), np.linspace(x2Min, x2Max))
h = sigmoid(poly.fit_transform(np.c_[xx1.ravel(), xx2.ravel()]).dot(thetas[-1]))
h = h.reshape(xx1.shape)
plt.contour(xx1, xx2, h, [0.5], colors='red', linewidth=.5)
Out[20]:
