python 画图实战训练
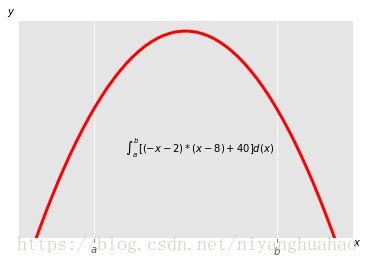
1. 函数积分图
import matplotlib.pyplot as plt
import numpy as np
def func(x):
return -(x-2)*(x-8)+40
x=np.linspace(0,10)
y=func(x)
fig,ax=plt.subplots() #用于获取坐标轴
plt.plot(x,y,'r',linewidth=3)
a=2
b=8
ax.set_xticks([a,b]) #在坐标轴上加刻度
ax.set_yticks([])
ax.set_xticklabels(['$a$','$b$'])
plt.figtext(0.9,0.1,'$x$')
plt.figtext(0.1,0.9,'$y$')
ax.text(3,35,r'$\int_a^b [(-x-2)*(x-8)+40 ]d(x)$')
plt.ylim(ymin=25)
plt.show()
2. 散点图以及看数据的分布
x=np.random.randn(200)
y=x+np.random.randn(200)*0.5
margin_border=0.1
width=0.6
margin_between=0.02
height=0.2
# 散点子图的参数,下边界、左边界以及长宽
left_s=margin_border
bottom_s=margin_border
height_s=width
width_s=width
#映射到X周的右边图参数
left_x=margin_border
bottom_x=margin_border+width+margin_between
height_x=width
width_x=height
#
left_y=margin_border+width+margin_between
bottom_y=margin_border
height_y=height
width_y=width
#生成画布
plt.figure(1,figsize=(8,8))
rect_s=[left_s,bottom_s,height_s,width_s]
rect_x=[left_x,bottom_x,height_x,width_x]
rect_y=[left_y,bottom_y,height_y,width_y]
axscatter=plt.axes(rect_s)
axhisx=plt.axes(rect_x)
axhisy=plt.axes(rect_y)
axhisx.set_xticks([])
axhisy.set_yticks([])
axscatter.scatter(x,y)
plt.show()
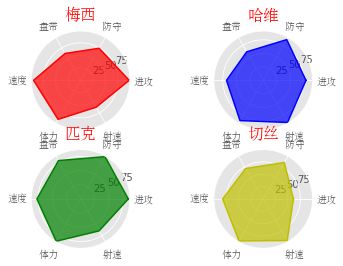
3.球员能力图
# -*- coding: utf-8 -*-
import matplotlib.pyplot as plt
import numpy as np
from matplotlib.font_manager import FontProperties
font= FontProperties(fname=r'c:\Windows\Fonts\simsun.ttc',size=10)
plt.style.use('ggplot')
#生成4个子图
ax1=plt.subplot(221,projection='polar')
ax2=plt.subplot(222,projection='polar')
ax3=plt.subplot(223,projection='polar')
ax4=plt.subplot(224,projection='polar')
#定义半径,并收尾相连
theta=np.linspace(0,2*np.pi,6,endpoint=False)
theta=np.append(theta,theta[0])
#定义4位球员的能力,并随机生成值,使用字典的方式比较简单
ability_size=6
ability_label=[u'进攻',u'防守',u'盘带',u'速度',u'体力',u'射速']
player={
'M':np.random.randint(size=ability_size,low=60,high=99),
'H':np.random.randint(size=ability_size,low=60,high=99),
'P':np.random.randint(size=ability_size,low=60,high=99),
'Q':np.random.randint(size=ability_size,low=60,high=99)
}
#使首尾相连
player['M']=np.append(player['M'],player['M'][0])
player['H']=np.append(player['H'],player['H'][0])
player['P']=np.append(player['P'],player['P'][0])
player['Q']=np.append(player['Q'],player['Q'][0])
# 画图 并填充颜色
ax1.plot(theta,player['M'],'r')
ax1.fill(theta,player['M'],'r',alpha=0.7)
ax1.set_xticks(theta)
ax1.set_xticklabels(ability_label,fontproperties=font)
ax1.set_title(u'梅西',fontproperties=font,color='r',size=16)
ax2.plot(theta,player['H'],'b')
ax2.fill(theta,player['H'],'b',alpha=0.7)
ax2.set_xticks(theta)
ax2.set_xticklabels(ability_label,fontproperties=font)
ax2.set_title(u'哈维',fontproperties=font,color='r',size=16)
ax3.plot(theta,player['P'],'g')
ax3.fill(theta,player['P'],'g',alpha=0.7)
ax3.set_xticks(theta)
ax3.set_xticklabels(ability_label,fontproperties=font)
ax3.set_title(u'匹克',fontproperties=font,color='r',size=16)
ax4.plot(theta,player['Q'],'y')
ax4.fill(theta,player['Q'],'y',alpha=0.7)
ax4.set_xticks(theta)
ax4.set_xticklabels(ability_label,fontproperties=font)
ax4.set_title(u'切丝',fontproperties=font,color='r',size=16)
plt.show()


