机器学习数据集之泰坦尼克
泰坦尼克号乘客数据集和鸢尾花数据集一样, 是机器学习中最常用的样例数据集之一
下载数据集
登录 https://www.kaggle.com , 在帐户页面中
https://www.kaggle.com/walterfan/account 页面上选择 "Create API Token" , 下载 kaggle.json
文件内容为
{"username":"$user_name","key":"$user_key"}
安装 kaggle , 下载 titanic 数据集, 先设置一下环境
cp kaggle.json ~/.kaggle/kaggle.json

#或者

chmod 600 /workspace/config/kaggle.json
export KAGGLE_CONFIG_DIR=/workspace/config/kaggle.json

#或者

export KAGGLE_USERNAME=$user_name
export KAGGLE_KEY=$user_key

pip install kaggle
kaggle competitions download -c titanic
数据集概览
数据分为三个 csv 文件
- 训练数据集: training set (train.csv) 用来构建机器学习的模型
PassengerId,Survived,Pclass,Name,Sex,Age,SibSp,Parch,Ticket,Fare,Cabin,Embarked
1,0,3,"Braund, Mr. Owen Harris",male,22,1,0,A/5 21171,7.25,,S
2,1,1,"Cumings, Mrs. John Bradley (Florence Briggs Thayer)",female,38,1,0,PC 17599,71.2833,C85,C
3,1,3,"Heikkinen, Miss. Laina",female,26,0,0,STON/O2. 3101282,7.925,,S
4,1,1,"Futrelle, Mrs. Jacques Heath (Lily May Peel)",female,35,1,0,113803,53.1,C123,S
...
测试数据集: test set (test.csv), 可用来测试你的机器学习模型,同样的数据结构
预测结果样例 gender_submission.csv, 一组假设所有和只有女性乘客存活的预测
PassengerId,Survived
892,0
893,1
894,0
895,0
896,1
....
数据字典
| 变量 | 定义 | 键值 |
|---|---|---|
| survival | Survival 存活与否 | 0 = No, 1 = Yes |
| pclass | Ticket class 座舱等级 | 1 = 1st, 2 = 2nd, 3 = 3rd |
| sex | gender 性别 | |
| Age | Age in years 年龄 | |
| sibsp | # of siblings / spouses aboard the Titanic 船上的兄弟姐妹或配偶个数 | |
| parch | # of parents / children aboard the Titanic 船上的父母或子女个数 | |
| ticket | Ticket number 票号 | |
| fare | Passenger fare 票价 | |
| cabin | Cabin number 座舱号 | |
| embarked | Port of Embarkation 登船港口 | C = Cherbourg 瑟堡, Q = Queenstown 皇后镇, S = Southampton 南安普敦 |
绘制直方图来揭示泰坦尼克号上乘客的年龄分布
import numpy as np
import pandas as pd
import matplotlib.pyplot as plt
import matplotlib.mlab as mlab

from matplotlib.ticker import PercentFormatter

plt.title('Passenger Age Distribution')
plt.xlabel('Age')
plt.ylabel('Frequency')

# 读取泰坦尼克号的数据集
titanic = pd.read_csv('./titanic/train.csv')
# 去除无年龄数据的样本
titanic.dropna(subset=['Age'], inplace=True)


plt.hist(titanic.Age, # 绘图数据
        bins = 10 # 指定直方图的的区间, 划分为10组
        color = 'steelblue', # 指定填充色
        edgecolor = 'k', # 指定直方图的边界色
        label = 'age ',# 指定标签
        alpha = 0.7 )# 指定透明度

plt.legend()
plt.show()
横轴是样本分组, 按照 bins 参数将年龄分为10个区间, 每组区间为10岁
纵轴是样本频次, 看起来在 20 到 30 岁之间的乘客人数较多, 儿童的人数也不少
将normed 参数指定为 True, 则绘制频率直方图
import numpy as np
import pandas as pd
import matplotlib.pyplot as plt
import matplotlib.mlab as mlab

from matplotlib.ticker import PercentFormatter

plt.title('Passenger Age Distribution')
plt.xlabel('Age')
plt.ylabel('Frequency')

# 读取泰坦尼克号的数据集
titanic = pd.read_csv('./titanic/train.csv')
# 去除无年龄数据的样本
titanic.dropna(subset=['Age'], inplace=True)


plt.hist(titanic.Age, # 绘图数据
        bins = np.arange(titanic.Age.min(),titanic.Age.max(),10), # 指定直方图的条形, 从最大到最小, 10岁为一个台阶
        normed = True,#指定为频率直方图
        color = 'steelblue', # 指定填充色
        edgecolor = 'k', # 指定直方图的边界色
        label = 'age frequency',# 指定标签
        alpha = 0.7 )# 指定透明度

plt.gca().yaxis.set_major_formatter(PercentFormatter(0.1))

plt.legend()
plt.show()
可以看出10岁以下儿童占总乘客人数将近10%, 而20~40岁之间的乘客人数超过一半
将cumulative参数设为 true, 再看看累积频率分布
import numpy as np
import pandas as pd
import matplotlib.pyplot as plt
import matplotlib.mlab as mlab

from matplotlib.ticker import PercentFormatter

plt.title('Passenger Age Distribution')
plt.xlabel('Age')
plt.ylabel('Frequency')

# 读取泰坦尼克号的数据集
titanic = pd.read_csv('./titanic/train.csv')
# 去除无年龄数据的样本
titanic.dropna(subset=['Age'], inplace=True)


plt.hist(titanic.Age, # 绘图数据
        bins = np.arange(titanic.Age.min(),titanic.Age.max(),10), # 指定直方图的条形, 从最大到最小, 10岁为一个台阶
        normed = True,#指定为频率直方图
        color = 'steelblue', # 指定填充色
        edgecolor = 'k', # 指定直方图的边界色
        cumulative = True, # 积累直方图
        label = 'age cumulative frequency',# 指定标签
        alpha = 0.7 )# 指定透明度

plt.gca().yaxis.set_major_formatter(PercentFormatter(1))

plt.legend()
plt.show()
可以看出80%的乘客的岁数在40岁以下
再看看男女乘客的存活比率与年龄的关系
import numpy as np
import pandas as pd
import seaborn as sns


# 读取泰坦尼克号的数据集
titanic = pd.read_csv('./titanic/train.csv')
# 去除无年龄数据的样本
titanic.dropna(subset=['Age'], inplace=True)

survived = 'survived'
not_survived = 'not survived'

fig, axes = plt.subplots(nrows=1, ncols=2,figsize=(10, 4))
women = titanic[titanic['Sex']=='female']
men = titanic[titanic['Sex']=='male']

ax = sns.distplot(women[women['Survived']==1].Age.dropna(), bins=18, label = survived, ax = axes[0], kde =False)
ax = sns.distplot(women[women['Survived']==0].Age.dropna(), bins=40, label = not_survived, ax = axes[0], kde =False)
ax.legend()
ax.set_title('Female')

ax = sns.distplot(men[men['Survived']==1].Age.dropna(), bins=18, label = survived, ax = axes[1], kde = False)
ax = sns.distplot(men[men['Survived']==0].Age.dropna(), bins=40, label = not_survived, ax = axes[1], kde = False)
ax.legend()
_ = ax.set_title('Male')
plt.show()
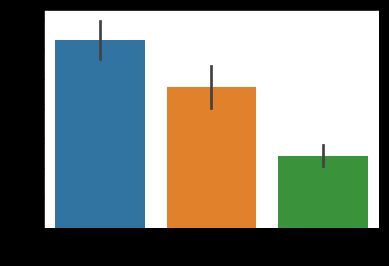
再看看座舱等级与存活率的关系
import numpy as np
import pandas as pd
import seaborn as sns

titanic = pd.read_csv('./titanic/train.csv')
sns.barplot(x='Pclass', y='Survived', data=titanic)
plt.show()
参考资料
- https://www.kaggle.com/c/titanic/data
- https://www.kesci.com/home/project/59f6f21bc5f3f511952c2966
- https://towardsdatascience.com/predicting-the-survival-of-titanic-passengers-30870ccc7e8


