kaggle竞赛:泰坦尼克幸存者预测
kaggle竞赛:泰坦尼克幸存者预测——(一)
import pandas as pd
import numpy as np
import matplotlib.pyplot as plt
import seaborn as sns
import os

import warnings
warnings.filterwarnings('ignore')

%matplotlib inline
导入数据
titanic = pd.read_csv(r'E:\DataScience\ML\Titanic\train.csv')

titanic_test = pd.read_csv(r'E:\DataScience\ML\Titanic\test.csv')

titanic.head()| PassengerId | Survived | Pclass | Name | Sex | Age | SibSp | Parch | Ticket | Fare | Cabin | Embarked | |
|---|---|---|---|---|---|---|---|---|---|---|---|---|
| 0 | 1 | 0 | 3 | Braund, Mr. Owen Harris | male | 22.0 | 1 | 0 | A/5 21171 | 7.2500 | NaN | S |
| 1 | 2 | 1 | 1 | Cumings, Mrs. John Bradley (Florence Briggs Th… | female | 38.0 | 1 | 0 | PC 17599 | 71.2833 | C85 | C |
| 2 | 3 | 1 | 3 | Heikkinen, Miss. Laina | female | 26.0 | 0 | 0 | STON/O2. 3101282 | 7.9250 | NaN | S |
| 3 | 4 | 1 | 1 | Futrelle, Mrs. Jacques Heath (Lily May Peel) | female | 35.0 | 1 | 0 | 113803 | 53.1000 | C123 | S |
| 4 | 5 | 0 | 3 | Allen, Mr. William Henry | male | 35.0 | 0 | 0 | 373450 | 8.0500 | NaN | S |
| 单词 | 翻译 | Key |
|---|---|---|
| survival | 是否幸存 | 0 = No, 1 = Yes |
| pclass | 社会阶层 | 1 = 精英, 2 = 中层 , 3 = 普通民众 |
| sex | 性别 | |
| Age | 年龄 | |
| sibsp | 船上兄弟/姐妹的个数 | |
| parch | 船上父母/孩子的个数 | |
| ticket | 船票号 | |
| fare | 船票价格 | |
| cabin | 船舱号码 | |
| embarked | 登船口 | C = Cherbourg, Q = Queenstown, S = Southampton |
# 查看数据简单的统计

titanic.describe()| PassengerId | Survived | Pclass | Age | SibSp | Parch | Fare | |
|---|---|---|---|---|---|---|---|
| count | 891.000000 | 891.000000 | 891.000000 | 714.000000 | 891.000000 | 891.000000 | 891.000000 |
| mean | 446.000000 | 0.383838 | 2.308642 | 29.699118 | 0.523008 | 0.381594 | 32.204208 |
| std | 257.353842 | 0.486592 | 0.836071 | 14.526497 | 1.102743 | 0.806057 | 49.693429 |
| min | 1.000000 | 0.000000 | 1.000000 | 0.420000 | 0.000000 | 0.000000 | 0.000000 |
| 25% | 223.500000 | 0.000000 | 2.000000 | 20.125000 | 0.000000 | 0.000000 | 7.910400 |
| 50% | 446.000000 | 0.000000 | 3.000000 | 28.000000 | 0.000000 | 0.000000 | 14.454200 |
| 75% | 668.500000 | 1.000000 | 3.000000 | 38.000000 | 1.000000 | 0.000000 | 31.000000 |
| max | 891.000000 | 1.000000 | 3.000000 | 80.000000 | 8.000000 | 6.000000 | 512.329200 |
# 查看数据概要

titanic.info()
# 统计空值
print(titanic.isnull().sum())数据清洗
处理缺失值
# 可以填充整个dataframe的空值
# titanic.fillna(0)

# 也可以单独填充一列
# titanic.Age.fillna(0)

titanic.Age.fillna(-30, inplace=True)

#查看为空的数据
titanic.isnull().sum()数据分析
性别Sex对生还与否的影响
# 做简单是汇总统计
titanic.groupby(['Sex','Survived'])['Survived'].count()
Sex Survived
female 0 81
1 233
male 0 468
1 109
Name: Survived, dtype: int64
# 生还率统计

df_sex = titanic[['Sex','Survived']].groupby(['Sex']).mean()
df_sex| Survived | |
|---|---|
| Sex | |
| female | 0.742038 |
| male | 0.188908 |
# 绘制柱状图

df_sex.plot(kind='bar',
            figsize=(8,6),
            rot=0,
            fontsize=18,
            stacked=True)
plt.grid(True, linestyle='--')
从上面可以发现,事实是与男性比女性的生存能力更强的经验常识相悖的,可以推测Lady First起到了很大的作用
社会阶层 Pclass与生还与否的关系
# 统计
titanic.groupby(['Pclass', 'Survived'])['Pclass'].count()
Pclass Survived
1 0 80
1 136
2 0 97
1 87
3 0 372
1 119
Name: Pclass, dtype: int64
df_pclass = titanic[['Pclass', 'Survived']].groupby(['Pclass']).mean()
df_pclass| Survived | |
|---|---|
| Pclass | |
| 1 | 0.629630 |
| 2 | 0.472826 |
| 3 | 0.242363 |
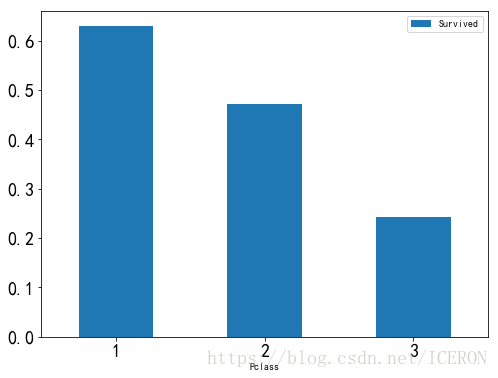
# 绘制柱状图

df_pclass.plot(kind='bar',
               rot=0,
               fontsize=18,
               figsize=(8,6))
plt.show()
可以看到,等级越高的人,生存几率越大,那么ladyfirst能否跨越等级界限呢?
df_psex = titanic[['Pclass', 'Sex', 'Survived']].groupby(['Pclass', 'Sex']).mean()
df_psex| Survived | ||
|---|---|---|
| Pclass | Sex | |
| 1 | female | 0.968085 |
| male | 0.368852 | |
| 2 | female | 0.921053 |
| male | 0.157407 | |
| 3 | female | 0.500000 |
| male | 0.135447 |
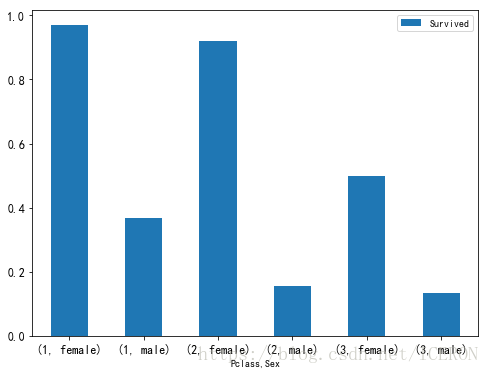
df_psex.plot(kind='bar',
             rot=0,
             fontsize=12,
             figsize=(8,6))
plt.show()
可以看到,ladyfirst确实跨越了社会等级界限,普通阶层的女性的生还率都高于精英阶层的男性生还率。
不过,无法忽视的是,不同等级的生还率还是有一定区别的。
年龄Age对生还与否的影响
绘图分析不同阶层和不同性别下的年龄分布情况以及与生还的关系
# 绘图分析不同阶层和不同性别下的年龄分布情况以及与生还的关系

fig, ax = plt.subplots(1, 2, figsize=(18,8))
sns.violinplot('Pclass','Age', hue='Survived', data=titanic, split=True, ax=ax[0])
ax[0].set_title('Pclass and Age  vs  Survived',size=18)
ax[0].set_yticks(range(0, 110, 10))

sns.violinplot("Sex", "Age", hue="Survived", data=titanic, split=True, ax=ax[1])
ax[1].set_title('Sex and Age  vs  Survived',size=18)
ax[1].set_yticks(range(0, 110, 10))
plt.show()
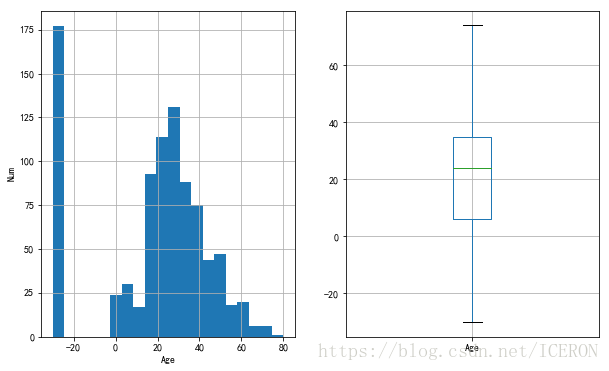
# 统计总体的年龄分布
plt.figure(figsize=(10,6))
plt.subplot(1,2,1)
titanic['Age'].hist(bins=20)
plt.xlabel('Age')
plt.ylabel('Num')
plt.subplot(1,2,2)
titanic.boxplot(column='Age', showfliers=False)
plt.show()因为年龄缺失值填充的问题,所以中间高出很多
page = sns.FacetGrid(titanic, hue="Survived",aspect=4)
page.map(sns.kdeplot,'Age',shade= True)
page.set(xlim=(-40, titanic['Age'].max()))
page.add_legend()
plt.show()
可以看到,孩子和中年人更容易获救。那么规则就是 lady and children first,缺省值中死亡更多
所以无法统计到年龄
f, ax = plt.subplots(figsize=(8,3))
ax.set_title('Sex Age dist', size=20)
sns.distplot(titanic[titanic.Sex=='female'].dropna().Age, hist=False, color='pink', label='female')
sns.distplot(titanic[titanic.Sex=='male'].dropna().Age, hist=False, color='blue', label='male')
ax.legend(fontsize=15)
plt.show()
可以看到,女性更加年轻些,孩子和中老年人中男性更多
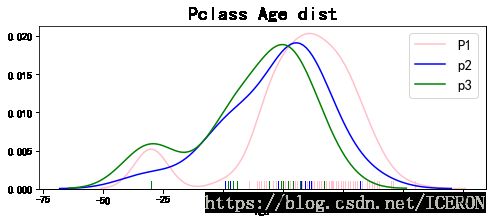
f, ax = plt.subplots(figsize=(8,3))
ax.set_title('Pclass Age dist', size=20)
sns.distplot(titanic[titanic.Pclass==1].dropna().Age, hist=False, color='pink', label='P1',rug=True)
sns.distplot(titanic[titanic.Pclass==2].dropna().Age, hist=False, color='blue', label='p2',rug=True)
sns.distplot(titanic[titanic.Pclass==3].dropna().Age, hist=False, color='g', label='p3',rug=True)
ax.legend(fontsize=15)
plt.show()
阶层越高,年纪更老龄化
有无兄弟姐妹 SibSp 对生还与否的影响
# 首先将数据分为有兄弟姐妹和没有兄弟姐妹两组

df_sibsp = titanic[titanic['SibSp'] != 0]
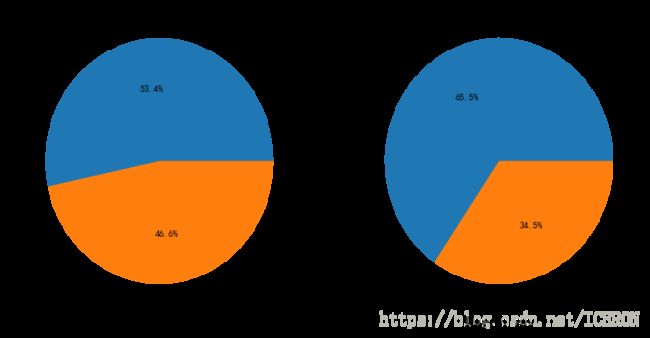
df_sibsp_no = titanic[titanic['SibSp'] == 0]plt.figure(figsize=(12,6))
plt.subplot(1,2,1)
df_sibsp['Survived'].value_counts().plot(kind='pie',labels=['No Survived', 'Survived'], autopct = '%1.1f%%')
plt.xlabel('sibsp',fontsize=18)
plt.subplot(1,2,2)
df_sibsp_no['Survived'].value_counts().plot(kind='pie',labels=['No Survived', 'Survived'], autopct = '%1.1f%%')
plt.xlabel('sibsp_no',fontsize=18)
plt.show()有了兄弟姐妹的帮助,似乎更能在险境中存活
有无父母孩子 Parch 对生还与否的影响
方法同上
# 按照有无父母孩子分组
df_parch = titanic[titanic['Parch'] != 0]
df_parch_no = titanic[titanic['Parch'] == 0]

plt.figure(figsize=(12,6))
plt.subplot(1,2,1)
df_sibsp['Survived'].value_counts().plot(kind='pie',labels=['No Survived', 'Survived'], autopct = '%1.1f%%')
plt.xlabel('Parch',fontsize=18)

plt.subplot(1,2,2)
df_sibsp_no['Survived'].value_counts().plot(kind='pie',labels=['No Survived', 'Survived'], autopct = '%1.1f%%')
plt.xlabel('Parch_no',fontsize=18)

plt.show()
从之前的分析中知道,孩子是特殊照顾的对象,而孩子一般是有父母跟随的。即使都是成年人,互相帮助存活概率也更高。
亲人数量对生还与否的影响
是否亲人越多,生还可能性越大呢?
fig,ax = plt.subplots(1, 2, figsize=(12,8))
titanic[['Parch','Survived']].groupby(['Parch']).mean().plot(kind='bar',ax=ax[0])
ax[0].set_title('Parch and Survived')

titanic[['SibSp','Survived']].groupby(['SibSp']).mean().plot.bar(ax=ax[1])
ax[1].set_title('SibSp and Survived')
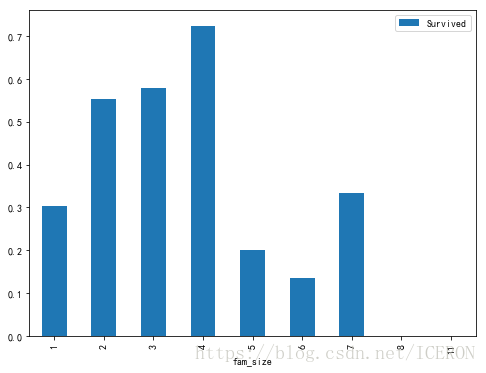
plt.show()titanic['fam_size'] = titanic['SibSp'] + titanic['Parch'] + 1
titanic[['fam_size','Survived']].groupby(['fam_size']).mean().plot.bar(figsize=(8,6))
plt.show()从上可以看出,家庭成员在1-4人生还率最高,推测应该是这样正好组成了可以互帮互助,行动又不臃肿从小组。
而后面7人家庭成员的存活率上升,推测应该是人数上升后,至少存活一人的概率增加。
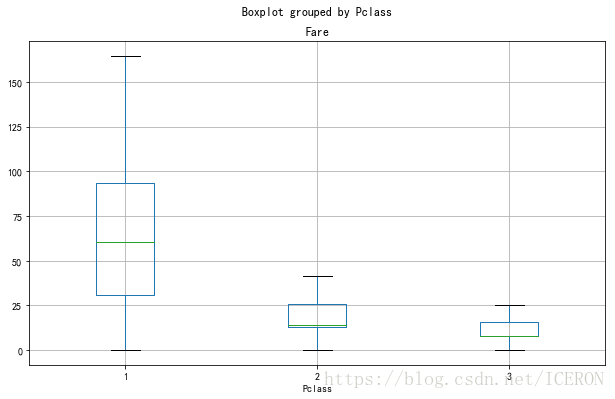
# 绘制票价分布图
titanic['Fare'].plot(kind='hist',bins=100,figsize=(10,6), grid=True)

titanic.boxplot(column='Fare', by='Pclass',showfliers=False,figsize=(10,6))
plt.show()titanic['Fare'].describe()count 891.000000
mean 32.204208
std 49.693429
min 0.000000
25% 7.910400
50% 14.454200
75% 31.000000
max 512.329200
Name: Fare, dtype: float64
# 绘制生还者非生还者票价分析
titanic.boxplot(column='Fare', by='Survived',showfliers=False,showmeans=True)
可以看到,幸存者的票价普遍更高,符合之前阶层越高,生还几率越大的推测
船舱号码 Cabin 对生还与否的影响
按照查询的资料,我认为乘客所处的船舱应该是跟是否生还有很大关系的,特别是下层的乘客,下部船舱快速进水,通向甲板的路不难想象也是混作一团,这就大大减少了生还可能。但是,此字段缺失数据多达600多个,所以只做下简单的数据分析。(不过我认为,票价和船舱应该有对应关系,如果能知道票价与船舱对应的史料就最好了)
titanic.Cabin.isnull().value_counts()True 687
False 204
Name: Cabin, dtype: int64
titanic.groupby(by=titanic.Cabin.isnull())['Survived'].mean()Cabin
False 0.666667
True 0.299854
Name: Survived, dtype: float64
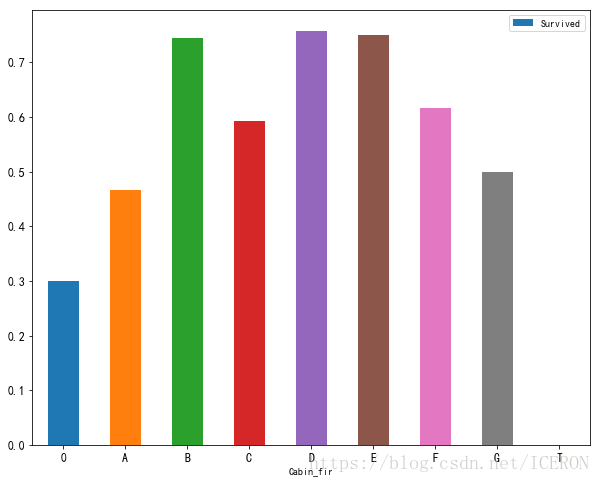
由上可知,缺失值的生存率很低,那么可以将Cabin是否为空作为一个特征!
titanic['Cabin_fir'] = titanic.Cabin.fillna('0').str.split(' ').apply(lambda x: x[0][0])
df_cabin_fir = titanic.groupby(by='Cabin_fir')['Survived'].mean()
print(df_cabin_fir)

df_cabin_fir.plot(kind='bar',
                 rot=0,
                 legend=True,figsize=(10,8),
                 fontsize=12)
plt.show()
Cabin_fir
0 0.299854
A 0.466667
B 0.744681
C 0.593220
D 0.757576
E 0.750000
F 0.615385
G 0.500000
T 0.000000
Name: Survived, dtype: float64
df_cabin_fare = titanic.groupby(by='Cabin_fir')['Fare','Survived'].mean()
df_cabin_fare| Fare | Survived | |
|---|---|---|
| Cabin_fir | ||
| 0 | 19.157325 | 0.299854 |
| A | 39.623887 | 0.466667 |
| B | 113.505764 | 0.744681 |
| C | 100.151341 | 0.593220 |
| D | 57.244576 | 0.757576 |
| E | 46.026694 | 0.750000 |
| F | 18.696792 | 0.615385 |
| G | 13.581250 | 0.500000 |
| T | 35.500000 | 0.000000 |
在有记录的乘客中,可以发现,BC舱位总统套间,掏钱最多,DE为贵宾舱,费用中等,其余为普通舱。生还率大致符合阶层的情况。至于为何C舱生还率
低于BDE,暂不分析,推测应该与所处舱位位置不佳,男性占比大,年龄偏大有关。
登船地点 Embarked 对生还与否的影响
泰坦尼克号从英国南安普敦出发,途经法国瑟堡-奥克特维尔以及爱尔兰昆士敦 —— 百度百科
南安普顿对应 S = Southampton, 瑟堡-奥克特维尔对应 C = Cherbourg,昆士敦对应 Q = Queenstown
titanic.groupby(by='Embarked')['Survived'].mean().plot(kind='bar', rot=0, fontsize=15, legend=True)
plt.show()
df_embarked = titanic.groupby(by='Embarked')['Survived','Fare'].agg(['mean', 'count'])
df_embarked| Survived | Fare | |||
|---|---|---|---|---|
| mean | count | mean | count | |
| Embarked | ||||
| C | 0.553571 | 168 | 59.954144 | 168 |
| Q | 0.389610 | 77 | 13.276030 | 77 |
| S | 0.336957 | 644 | 27.079812 | 644 |
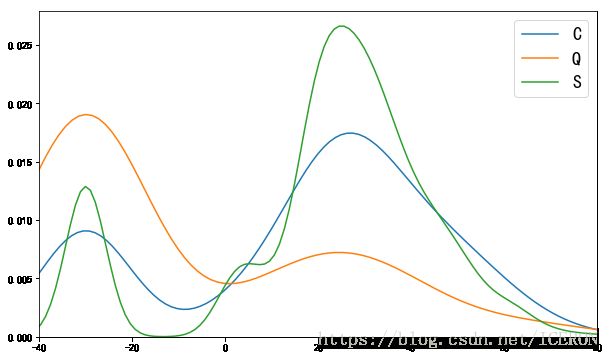
ax = plt.figure(figsize=(10,6)).add_subplot(111)
ax.set_xlim([-40, 80])
sns.kdeplot(titanic[titanic.Embarked=='C'].Age, ax=ax, label='C')
sns.kdeplot(titanic[titanic.Embarked=='Q'].Age, ax=ax, label='Q')
sns.kdeplot(titanic[titanic.Embarked=='S'].Age, ax=ax, label='S')
ax.legend(fontsize=18)
plt.show()
C和S上岸的乘客的年龄分布较为相似,Q上岸的人很多没有年龄。
C和S比较,C口岸的人中有更多的孩子和老人
名字 Name 对生还与否的影响
通过对名字该字段的初步观察,发现名字中不但透漏出性别,还代表着一个人的地位,年龄,职业等
比如Master,Miss等
# 称谓统计
titanic['Title'] = titanic.Name.apply(lambda x: x.split(',')[1].split('.')[0])
titanic['Title'].value_counts()
Mr 517
Miss 182
Mrs 125
Master 40
Dr 7
Rev 6
Mlle 2
Major 2
Col 2
the Countess 1
Ms 1
Don 1
Capt 1
Mme 1
Sir 1
Lady 1
Jonkheer 1
Name: Title, dtype: int64
# 姓氏统计
titanic.Name.apply(lambda x: x.split(',')[1].split('.')[1]).value_counts()[:10]
John 9
James 7
William 6
Mary 6
William Henry 4
Ivan 4
William John 4
Bertha 4
Anna 3
Victor 3
Name: Name, dtype: int64
titanic[['Title','Survived']].groupby(['Title']).mean()| Survived | |
|---|---|
| Title | |
| Capt | 0.000000 |
| Col | 0.500000 |
| Don | 0.000000 |
| Dr | 0.428571 |
| Jonkheer | 0.000000 |
| Lady | 1.000000 |
| Major | 0.500000 |
| Master | 0.575000 |
| Miss | 0.697802 |
| Mlle | 1.000000 |
| Mme | 1.000000 |
| Mr | 0.156673 |
| Mrs | 0.792000 |
| Ms | 1.000000 |
| Rev | 0.000000 |
| Sir | 1.000000 |
| the Countess | 1.000000 |
# 不同称呼的生存率统计
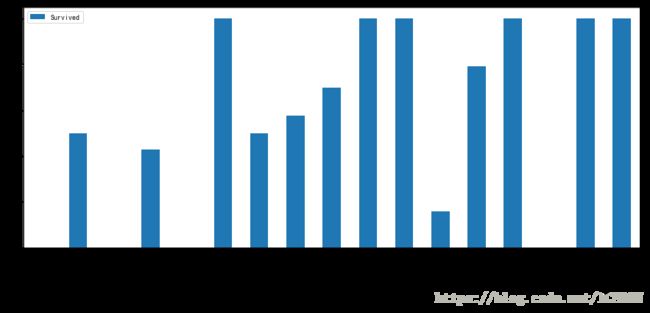
titanic[['Title','Survived']].groupby(['Title']).mean().plot.bar(rot=45, figsize=(15,6), fontsize=12)
plt.show()
可以看到,称谓确实与获救率有关,以为称谓往往与人的性别,地位有关。
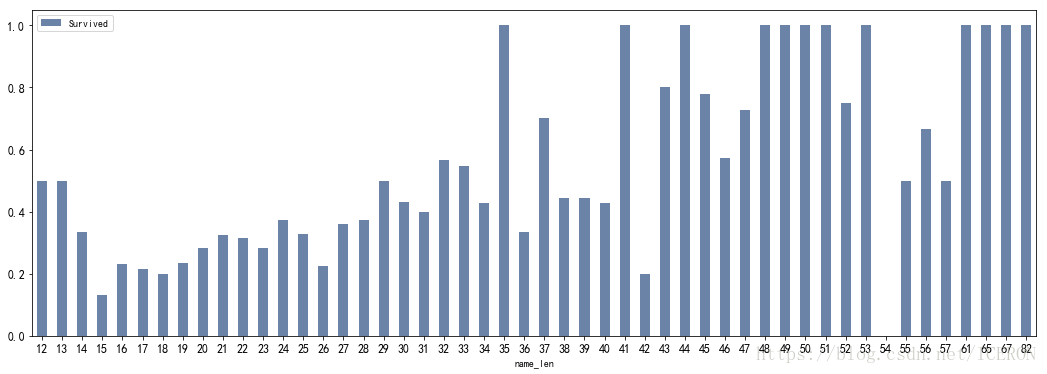
换个角度,我们知道,歪果仁的名字中通常会加入家族名字,爵位等,所以是不是名字越长就越能像是一个家族的历史和地位呢?那么名字的长短是否能够显示出人的地位从而影响到是否获救?
titanic['name_len'] = titanic['Name'].apply(len)
df_namelen = titanic[['name_len','Survived']].groupby(['name_len'],as_index=False).mean()
df_namelen.plot.bar(x='name_len',y='Survived',figsize=(18,6),rot=0,colormap='Blues_r',alpha=0.6,fontsize=12)
plt.show()
看来猜想是正确的,名字的长度确实与是否获救有一定关系
Ticket
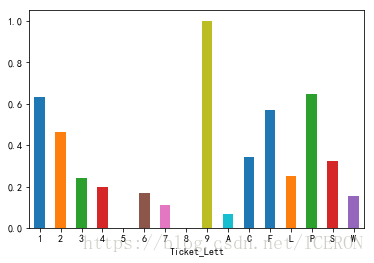
类别比较大,观察可以发现,票号开头应该代表着船舱区域,故提取分析
titanic['Ticket_Lett'] = titanic['Ticket'].apply(lambda x: str(x)[0])
titanic['Ticket_Lett'] = titanic['Ticket_Lett'].apply(lambda x: str(x))
titanic.groupby(titanic['Ticket_Lett'])['Survived'].mean()
Ticket_Lett
1 0.630137
2 0.464481
3 0.239203
4 0.200000
5 0.000000
6 0.166667
7 0.111111
8 0.000000
9 1.000000
A 0.068966
C 0.340426
F 0.571429
L 0.250000
P 0.646154
S 0.323077
W 0.153846
Name: Survived, dtype: float64
titanic.groupby(titanic['Ticket_Lett'])['Survived'].mean().plot.bar(rot=0)可以看到,船票不同开头的生存率不同,可以作为一个特征
通过以上的分析,我们发现,乘客获救与否,与多种因素有关。包括性别,年龄,阶级等。在这大灾难面前,强壮的男人死亡率反常的高,而女人和孩子反而更易存活,这不正常,但也是正常的,这应该就是文明发展的结果。
那么,如果你当时在泰坦尼克上,你是否会成功获救呢?下篇文章,将通过机器学习算法,来预测另一批乘客是否会活下来。
特征工程
变量转换
变量转换的目的是将数据转换为适用于模型使用的数据,不同模型接受不同类型的数据,Scikit-learn要求数据都是数字型numeric,所以我们要将一些非数字型的原始数据转换为数字型numeric
from sklearn.preprocessing import LabelEncoder
from sklearn.model_selection import train_test_split
from sklearn.linear_model import LogisticRegression
from sklearn.svm import SVC
from sklearn.ensemble import RandomForestClassifier
from sklearn.neighbors import KNeighborsClassifier
from sklearn.tree import DecisionTreeClassifier
from xgboost import XGBClassifier
import warnings
warnings.filterwarnings('ignore')os.chdir('E:\DataScience\ML\Titanic')
data_train = pd.read_csv('train.csv')
data_test = pd.read_csv('test.csv')
combine = pd.concat([data_train,data_test])对数据进行特征工程,也就是从各项参数中提取出对输出结果有或大或小的影响的特征,将这些特征作为训练模型的依据。 一般来说,我们会先从含有缺失值的特征开始
Embarked
因为该项的缺失值没几个,所以这里我们以众数来填充:
# 缺失值填充,众数为 S
combine['Embarked'] = combine['Embarked'].fillna('S')

# dummy处理
df = pd.get_dummies(combine['Embarked'], prefix='Embarked')
combine = pd.concat([combine, df], axis=1).drop('Embarked', axis=1)
Name_length
combine['Name_length'] = combine['Name'].apply(len)Title
combine['Title'] = combine['Name'].apply(lambda x: x.split(',')[1]).apply(lambda x:x.split('.')[0])
combine['Title'] = combine['Title'].apply(lambda x: x.strip())
combine['Title'] = combine['Title'].replace(['Major','Capt','Rev','Col','Dr'],'officer')
combine['Title'] = combine['Title'].replace(['Mlle','Miss'], 'Miss')
combine['Title'] = combine['Title'].replace(['Mme','Ms','Mrs'], 'Mrs')
combine['Title'] = combine['Title'].replace(['Master','Jonkheer'], 'Master')
combine['Title'] = combine['Title'].replace(['Don', 'Sir', 'the Countess', 'Dona', 'Lady'], 'Royalty')
df = pd.get_dummies(combine['Title'],prefix='Title')
combine = pd.concat([combine,df], axis=1)
Fare
该项只有一个缺失值,对该值进行填充,我们可以按照阶级均价来填充
combine['Fare'] = combine['Fare'].fillna(combine.groupby('Pclass')['Fare'].transform(np.mean))通过对Ticket简单的统计,我们可以看到部分票号数据有重复,同时结合亲属人数及名字的数据,和票价船舱等级对比,我们可以知道购买的票中有团体票,所以我们需要将团体票的票价分配到每个人的头上
combine['Group_Ticket'] = combine['Fare'].groupby(by=combine['Ticket']).transform('count')
combine['Fare'] = combine['Fare'] / combine['Group_Ticket']
combine.drop(['Group_Ticket'], axis=1, inplace=True)
# 分级
combine['Fare_1'] = np.where(combine['Fare'] <= 7.91,1,0)
combine['Fare_2'] = np.where((combine['Fare'] > 7.91) & (combine['Fare'] <= 14.454),1,0)
combine['Fare_3'] = np.where((combine['Fare'] > 14.454)& (combine['Fare'] <= 31),1,0)
combine['Fare_4'] = np.where((combine['Fare'] > 31),1,0)
combine = combine.drop('Fare',axis=1)Dead_female_family & Survive_male_family
前面分析可以知道,家庭的行为具有一致性,那么如果家族中有一个女的死亡,那么其他女性也倾向于死亡,反之,如果有男性生还,其他男性也会倾向于生还,为了防止模型无脑判断女性生还和男性死亡,在这里分出这两类情况。
combine['Fname'] = combine['Name'].apply(lambda x:x.split(',')[0])
combine['Familysize'] = combine['SibSp']+combine['Parch']
dead_female_Fname = list(set(combine[(combine.Sex=='female') & (combine.Age>=12) & (combine.Survived==0) & (combine.Familysize>1)]['Fname'].values))
survive_male_Fname = list(set(combine[(combine.Sex=='male') & (combine.Age>=12) & (combine.Survived==1) & (combine.Familysize>1)]['Fname'].values))
combine['Dead_female_family'] = np.where(combine['Fname'].isin(dead_female_Fname),1,0)
combine['Survive_male_family'] = np.where(combine['Fname'].isin(survive_male_Fname),1,0)
combine = combine.drop(['Name','Fname','Familysize'],axis=1)
Age
Age缺失值太多,可以按照阶级性别的平均年龄填充,也可以利用机器学习算法来预测,这里我们采用第一种方法
group = combine.groupby(['Title', 'Pclass'])['Age']
combine['Age'] = group.transform(lambda x: x.fillna(x.median()))
combine['IsChild'] = np.where(combine['Age']<=12,1,0)
# combine['Age'] = pd.cut(combine['Age'],5)
combine = combine.drop(['Title'],axis=1)
Cabin
Cabin的缺失值太多,但是根据之前的分析,该特征值的有无与生还与否也相关性,所以我们将其分为两类
combine['Cabin_0'] = np.where(combine['Cabin'].isnull(),1,0)
combine['Cabin_1'] = np.where(combine['Cabin'].isnull(),0,1)
combine = combine.drop('Cabin',axis=1)
Pclass
Pclass这一项,只需要将其转换为dummy形式就可以了
df = pd.get_dummies(combine['Pclass'], prefix='Pclass')
combine = pd.concat([combine, df], axis=1).drop('Pclass',axis=1)
Ticket
Ticket 在前面并没有分析,主要是因为里面有英文有数字,难以分析出规律,但是只看英文数字结合的票号,不难发现,票号前面的英文应该代表着位置信息,那么位置影响逃生路线,故将这部分提取出来做特征处理
combine['Ticket_Lett'] = combine['Ticket'].apply(lambda x: str(x)[0])
combine['Ticket_Lett'] = combine['Ticket_Lett'].apply(lambda x: str(x))

combine['High_Survival_Ticket'] = np.where(combine['Ticket_Lett'].isin(['1', '2', 'P','9','F']),1,0)
combine['mid_Survival_Ticket'] = np.where(combine['Ticket_Lett'].isin(['3','4','L','S']),1,0)
combine['Low_Survival_Ticket'] = np.where(combine['Ticket_Lett'].isin(['A','W','6','7']),1,0)
combine = combine.drop(['Ticket','Ticket_Lett'],axis=1)
Sex
对Sex进行one-hot编码
df = pd.get_dummies(combine['Sex'], prefix='Sex')
combine = pd.concat([combine, df],axis=1).drop('Sex',axis=1)
Parch and SibSp
亲友数量是会影响到生存率的,那么将这两项合为一项
combine['Family_size'] = np.where((combine['Parch']+combine['SibSp']==0),'Alone',
                                  np.where((combine['Parch']+combine['SibSp']<=3),'Small','Big'))

df = pd.get_dummies(combine['Family_size'], prefix='Family_size')
combine = pd.concat([combine,df],axis=1).drop(['SibSp','Parch','Family_size'],axis=1)
将所有特征转换正数值型编码
features = combine.drop(["PassengerId","Survived"], axis=1).columns
le = LabelEncoder()
for feature in features:
    le = le.fit(combine[feature])
    combine[feature] = le.transform(combine[feature])
将训练数据和测试数据分开
x_train = combine.iloc[:891,:].drop(['PassengerId', 'Survived'],axis=1)
y_train = combine.iloc[:891,:]['Survived']
x_test = combine.iloc[891:,:].drop(['PassengerId','Survived'], axis=1)
模型比较
# logistic Regression
Logreg = LogisticRegression()
Logreg.fit(x_train,y_train)
y_pred = Logreg.predict(x_test)
acc_logreg = round(Logreg.score(x_train, y_train) * 100,2)

# Support Vector Machines
svc = SVC()
svc.fit(x_train, y_train)
y_pred = svc.predict(x_test)
acc_svc = round(svc.score(x_train, y_train) *100,2)

# K-Nearest Neighbors
knn = KNeighborsClassifier(n_neighbors=3)
knn.fit(x_train, y_train)
y_pred = knn.predict(x_test)
acc_knn = round(knn.score(x_train, y_train) * 100, 2)

# Random Forest
rf = RandomForestClassifier(n_estimators=300,min_samples_leaf=4,class_weight={0:0.745,1:0.255})
rf.fit(x_train, y_train)
y_pred = rf.predict(x_test)
acc_rf = round(rf.score(x_train, y_train) * 100, 2)

# Decision Tree
dec_tree = DecisionTreeClassifier()
dec_tree.fit(x_train, y_train)
y_pred = dec_tree.predict(x_test)
acc_dec_tree = round(dec_tree.score(x_train,y_train) * 100,2)


# XGBoost
xgb = XGBClassifier()
xgb.fit(x_train,y_train)
y_pred = xgb.predict(x_test)
acc_xgb = round(xgb.score(x_train,y_train) * 100, 2)


models = pd.DataFrame({'model':['Logreg','svc','knn','rf','dec_tree','xgb'],
                       'Score':[acc_logreg,acc_svc,acc_knn,acc_rf,acc_dec_tree,acc_xgb]})

print(models.sort_values(by='Score', ascending=False))
Score model
4 99.21 dec_tree
5 89.11 xgb
2 87.32 knn
1 87.09 svc
0 86.31 Logreg
3 85.41 rf
# XGB
xgb = XGBClassifier()
xgb.fit(x_train,y_train)
y_pred = xgb.predict(x_test).astype(int)# 该列必须是整型,否则格式不对,得分0分(别问我怎么知道的)
# 只得到了78分的成绩
# logistic Regression
# Logreg = LogisticRegression()
# Logreg.fit(x_train,y_train)
# y_pred = Logreg.predict(x_test).astype(int)
# 只得到了78分的成绩 # Random Forest
# rf = RandomForestClassifier(n_estimators=100)
# rf.fit(x_train, y_train)
# y_pred = rf.predict(x_test).astype(int)subminssion = pd.DataFrame({"PassengerId": data_test["PassengerId"],"Survived": y_pred})
subminssion.to_csv('submission.csv',index=False)最后,提交结果后,发现得到了11% 的排名,这里没有做模型融合,模型的调参也不怎么熟练,特征工程也做的一般,所以还是有很大的优化空间的。


