python--从入门到实践--chapter 15 16 17 生成数据/下载数据/web API
1.随机漫步
random_walk.py
from random import choice
class RandomWalk():
    def __init__(self, num_points=5000):
        self.num_points = num_points
        self.x_value = [0]
        self.y_value = [0]
    def fill_walk(self):
        while len(self.x_value) < self.num_points:
            x_direction = choice([1, -1])
            x_distance = choice([0, 1, 2, 3, 4])
            x_step = x_direction * x_distance

            y_direction = choice([1, -1])
            y_distance = choice([0, 1, 2, 3, 4])
            y_step = y_direction * y_distance

            if x_step == 0 and y_step == 0:
                continue
            next_x = self.x_value[-1] + x_step
            next_y = self.y_value[-1] + y_step

            self.x_value.append(next_x)
            self.y_value.append(next_y)
randomWalk_visual.py
import matplotlib.pyplot as plt
from random_walk import RandomWalk
rw = RandomWalk(5000)
rw.fill_walk()
plt.figure(dpi=512, figsize=(10, 6))
point_number = list(range(rw.num_points))
plt.scatter(rw.x_value, rw.y_value, c=point_number, cmap=plt.cm.Blues, edgecolors='none', s=1)
plt.scatter(0, 0, c="green", edgecolors='none', s=100)
plt.scatter(rw.x_value[-1], rw.y_value[-1], c="red", edgecolors='none', s=100)
# plt.axis('off')
plt.show()
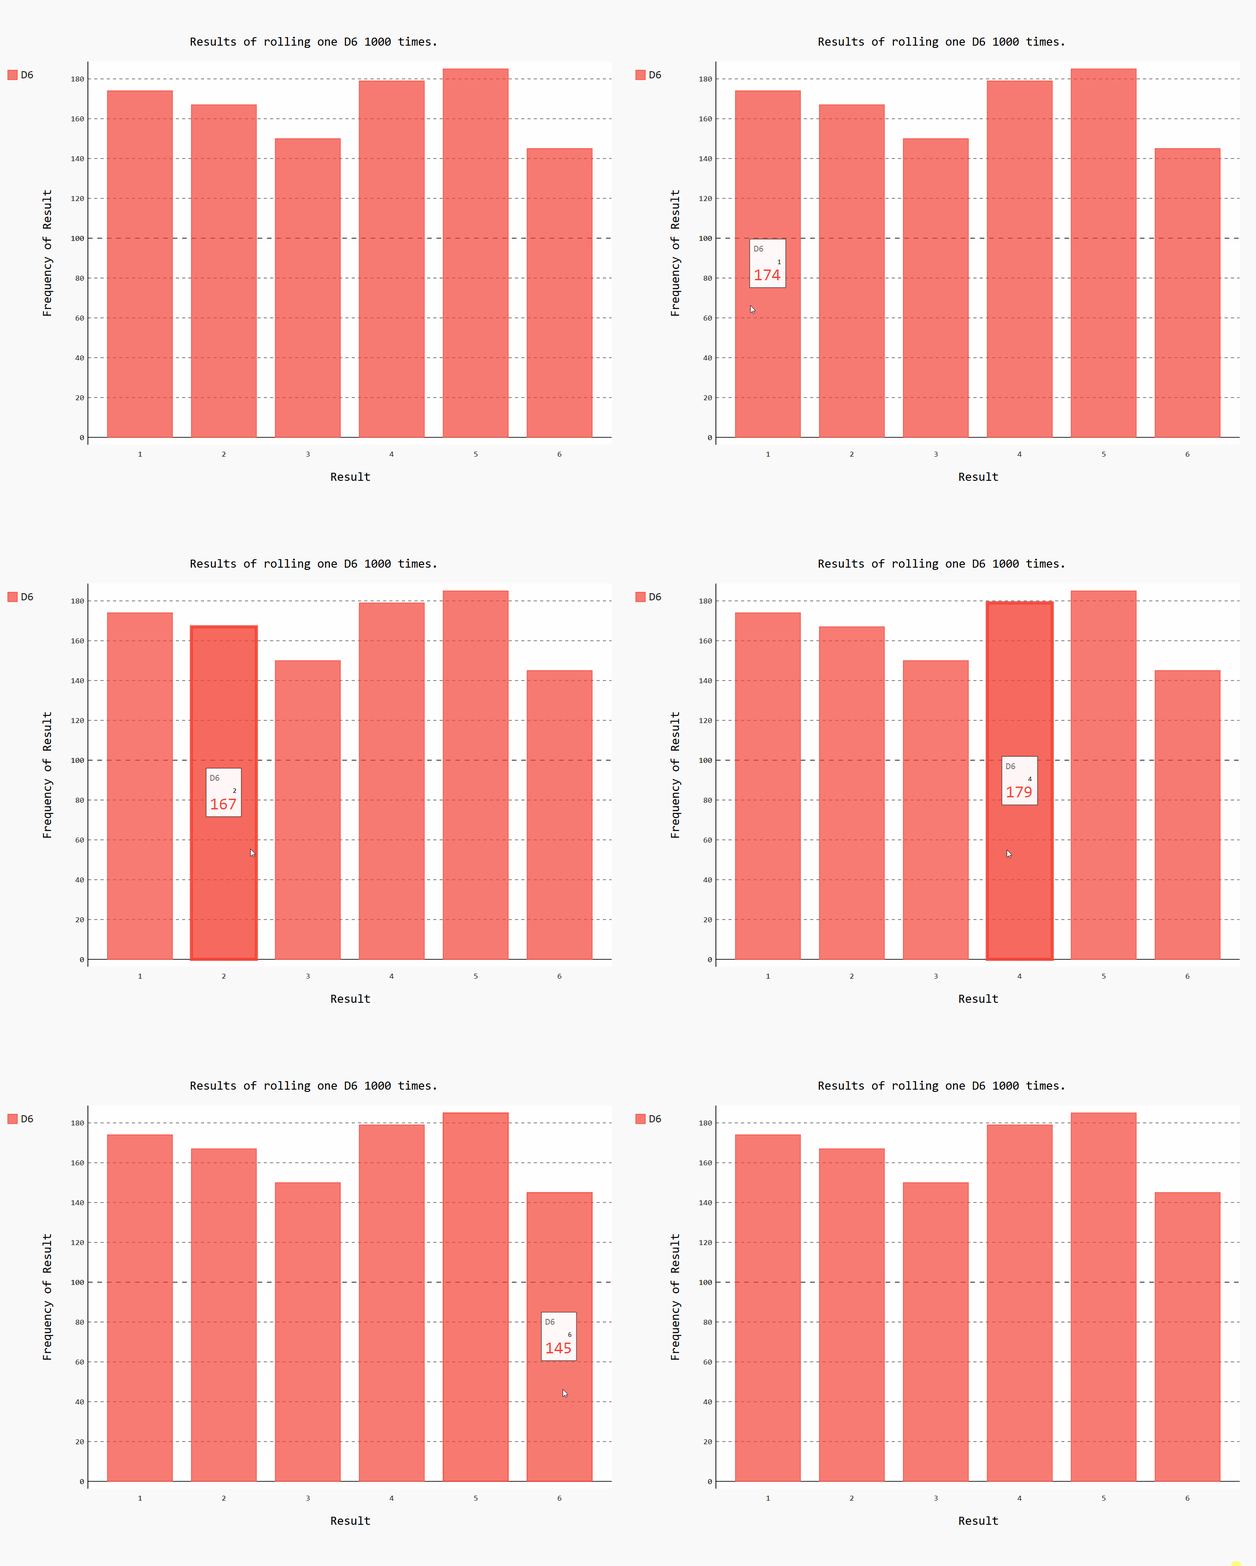
2.投1个六面骰子
dice.py
from random import randint
class Dice():
    def __init__(self, num_sides=6):
        self.num_sides = num_sides
    def roll(self):
        return randint(1, self.num_sides)
dice_visual.py
from dice import Dice
import pygal
d6 = Dice()
results = []
for roll_num in range(1000):
    result = d6.roll()
    results.append(result)
frequencies = []
for value in range(1, d6.num_sides+1):
    frequency = results.count(value)
    frequencies.append(frequency)
hist = pygal.Bar()
hist.title = "Results of rolling one D6 1000 times."
hist.x_labels = [x for x in range(1, 7)]
hist.x_title = "Result"
hist.y_title = "Frequency of Result"
hist.add('D6', frequencies)
hist.render_to_file("dice_visual.svg")
print(frequencies)
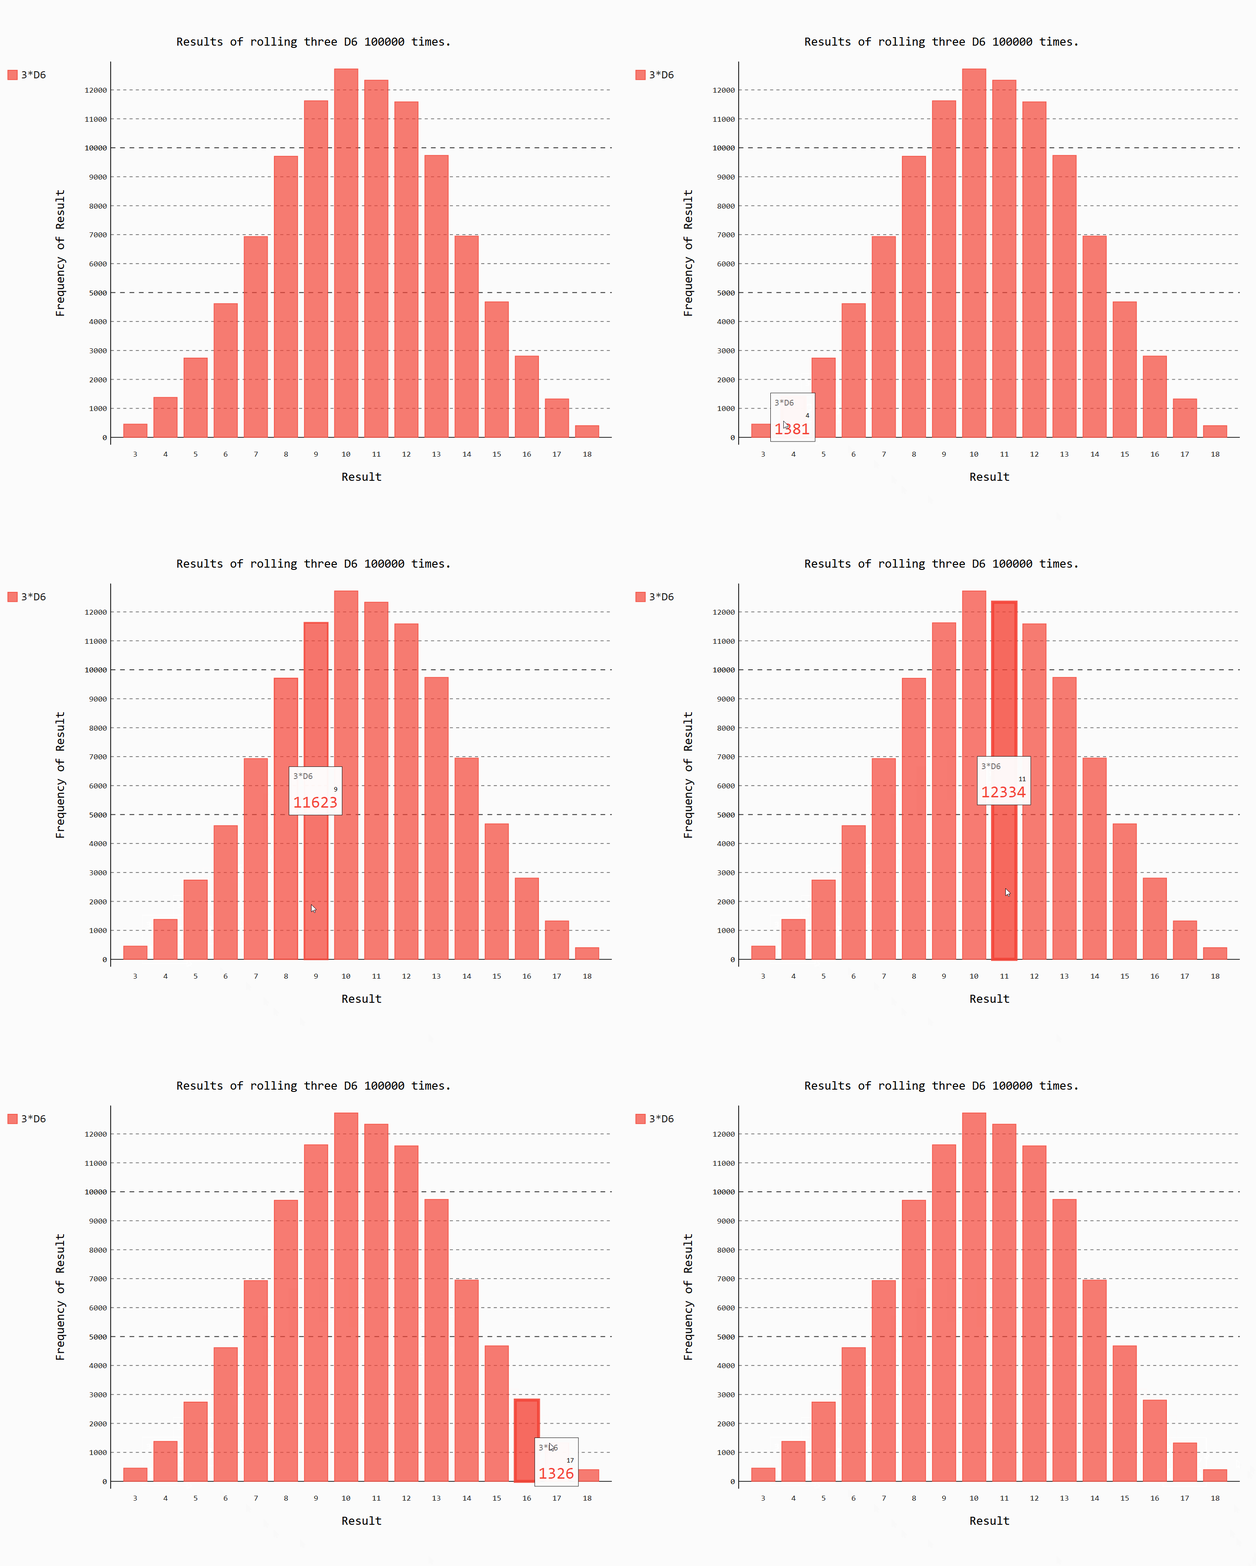
3.同时掷3个6面骰子
from dice import Dice
import pygal
d6_1 = Dice()
d6_2 = Dice()
d6_3 = Dice()
results = []
for roll_num in range(100000):
    result = d6_1.roll() + d6_2.roll() + d6_3.roll()
    results.append(result)
frequencies = []
for value in range(3, 19):
    frequency = results.count(value)
    frequencies.append(frequency)
hist = pygal.Bar()
hist.title = "Results of rolling three D6 100000 times."
hist.x_labels = [x for x in range(3, 19)]
hist.x_title = "Result"
hist.y_title = "Frequency of Result"
hist.add('3*D6', frequencies)
hist.render_to_file("dice_visual.svg")
print(frequencies)
4.同时掷两个骰子,将两个骰子的点数相乘。
from dice import Dice
import pygal
d6_1 = Dice()
d6_2 = Dice()
results = []
for roll_num in range(100000):
    result = d6_1.roll() * d6_2.roll()
    results.append(result)
frequencies = []
for value in range(1, 37):
    if results.count(value):
        frequency = results.count(value)
        frequencies.append(frequency)
x_data = []
for value in range(1, 37):
    if value in results:
        x_data.append(value)
hist = pygal.Bar()
hist.title = "Results of rolling two D6 100000 times."
hist.x_labels = x_data
hist.x_title = "Result"
hist.y_title = "Frequency of Result"
hist.add('D6*D6', frequencies)
hist.render_to_file("dice_visual.svg")
print(frequencies)
5.下载数据,可视化世界人口
免费数据下载地址 https://datahub.io
country_codes.py
from pygal_maps_world.i18n import COUNTRIES
def get_country_code(country_name):
    for code, name in COUNTRIES.items():
        if name == country_name:
            return code #从库里返回2个字母的国家编码
    return None
world_population.py
import json
from country_codes import get_country_code
import pygal.maps.world
from pygal.style import RotateStyle
from pygal.style import LightColorizedStyle #浅色方便印刷
filename = "population_data.json"
with open(filename) as f:
    pop_data = json.load(f)
cc_populations = {}
for pop_dict in pop_data:
    if(pop_dict["Year"] == 2010):
        country_name = pop_dict["Country Name"]
        population = pop_dict["Value"]
        code = get_country_code(country_name)
        if code:
            cc_populations[code] = population
cc_pops_1, cc_pops_2, cc_pops_3 = {}, {}, {}
for cc, pop in cc_populations.items():
    if pop < 10000000:
        cc_pops_1[cc] = pop
    elif pop < 1000000000:
        cc_pops_2[cc] = pop
    else:
        cc_pops_3[cc] = pop
print(len(cc_pops_1), len(cc_pops_2), len(cc_pops_3))
# wm_style = RotateStyle("#336699")
# wm_style = LightColorizedStyle
wm_style = RotateStyle("#336699", base_style=LightColorizedStyle)
wm = pygal.maps.world.World(style=wm_style)
wm.title = "World Population in 2010, by Country"
wm.add("0-10 million", cc_pops_1)
wm.add("10 million -1 billion", cc_pops_2)
wm.add("> 1 billion", cc_pops_3)
wm.render_to_file("world_population.svg")
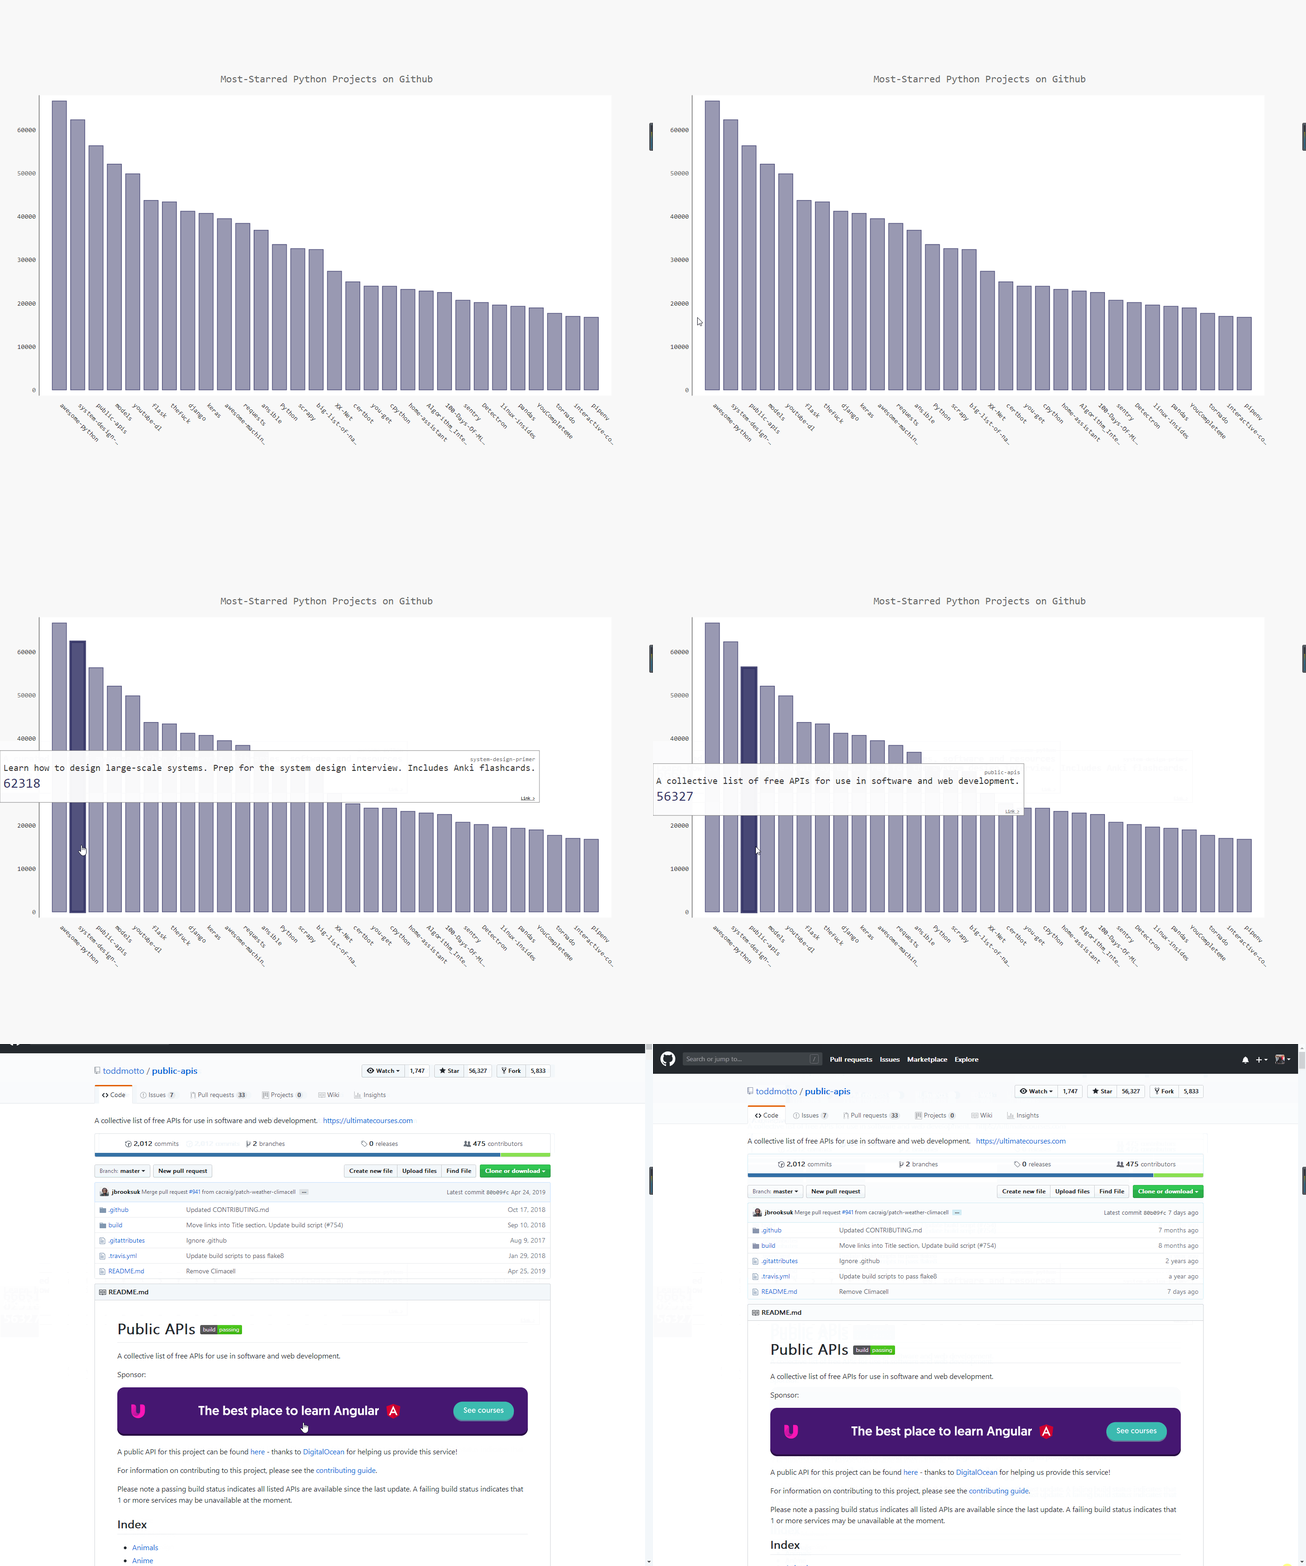
6.获取Github最多星的python项目
import requests
import pygal
from pygal.style import LightColorizedStyle as LCS, LightenStyle as LS
url = "https://api.github.com/search/repositories?q=language:python&sort=stars"
r = requests.get(url)
print("Status code: ", r.status_code)
response_dict = r.json()
print(response_dict.keys())
print("Total repositories: ", response_dict["total_count"])
repo_dicts = response_dict["items"]
names, plot_dicts = [], []
print("Repositories returned:", len(repo_dicts))
repo_dict = repo_dicts[0]   #第一个item
print("\nKeys:", len(repo_dict))
for key in sorted(repo_dict.keys()):
    print(key)
print("\nSelected information about first repository:")
for repo_dict in repo_dicts:
    # print('Name:', repo_dict['name'])
    # print('Owner:', repo_dict['owner']['login'])
    # print('Stars:', repo_dict['stargazers_count'])
    # print('Repository:', repo_dict['html_url'])
    # print('Description:', repo_dict['description'])
    names.append(repo_dict["name"])
    plot_dict = {
        "value": repo_dict["stargazers_count"],
        "label": repo_dict["description"],
        "xlink": repo_dict["html_url"]
        }
    plot_dicts.append(plot_dict)
my_style = LS("#333366", base_style=LCS)
my_config = pygal.Config()
my_config.x_label_rotation = 45
my_config.show_legend = False
my_config.title_font_size = 24
my_config.label_font_size = 14
my_config.major_label_font_size = 18
my_config.truncate_label = 15
my_config.show_y_guides = False
my_config.width = 1000
chart = pygal.Bar(my_config, style=my_style)
chart.title = "Most-Starred Python Projects on Github"
chart.x_labels = names
chart.add("", plot_dicts)
chart.render_to_file("python_repos.svg")


