基于 Twitter 的网络结构和社会群体演化
-
实验数据
链接:https://pan.baidu.com/s/1IDLVxAxlAxTlh2GM_AvlvQ
提取码:r079 -
实验目的
掌握从社交网络数据抽取用户关系并进行数据分析的方法。
- 实验环境
Windows 10 操作系统、python3.6、Gephi 0.9.2
- 实验内容
1.地震前后网络构建
根据附件 1 和附件 2 给出的推文数据,提取出用户发文时间、用户昵称、发文内容等关键字段,并根据这些信息构建地震前后的关系网络。
2.对构建好的网络进行度分析
为了对比地震对用户关系带来的影响,分别对去的英文使用者网络和日文使用者网络进行累积度分布变化统计、单独节点层面上的度变化统计并做对比分析。
3.对构建好的网络进行社区检测及对比分析
为了进一步了解地震前后的用户移动情况,请用桑基图显示在每个数据集中地震前后检测到的规模前 10 的社区中的用户移动情况并根据结果做进一步分析。
4.进一步分析
用其他方法,或在时间上进行细粒度动态网络分析
- 实验步骤
1.构建网络
(1)首先观察json文件的结构,根据教程提供的结构图如下:

我们需要的是response下红框圈出的几个属性,其中nick充当的是主码的角色,不会重复。
(2)分析结束后,我们可以编写提取某一个json中我们需要的字段的代码,代码如下:

基本思路是对每一个post都提取出nick,name,date,content四个值,做成一个python字典,放入列表中,最后返回列表。
(3)接下来我们提取所有before和after的json数据中的信息:

基本思路是对各个json文件均调用一次getJson方法,然后合并所得列表。
(4)现在我们可以根据得到的数据来构造图,代码如下:
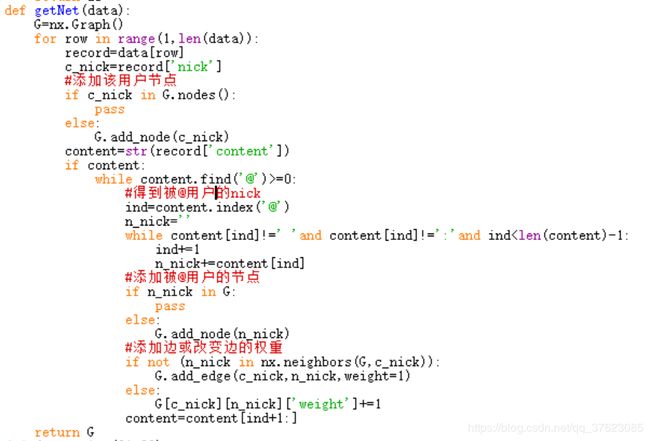
基本思路是对每一个用户——在图中添加其用户节点——得到被其@的用户——添加被@用户节点——添加或改变两点间边的权值
(4)得到图后,还要清理地震前后两张图的非公共节点,代码如下:
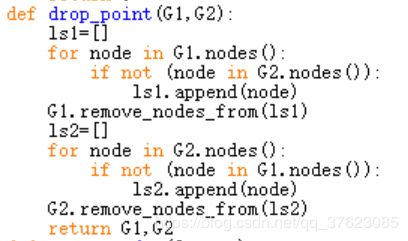
逻辑很简单,检测是否为非公共节点?是则删除,否则不删除。
(5)运行如下代码,就可以得到地震前后的两张图,并输出成gml文件,用于以后的图的可视化:

运行结果:
![]()
![]()

2.度分析
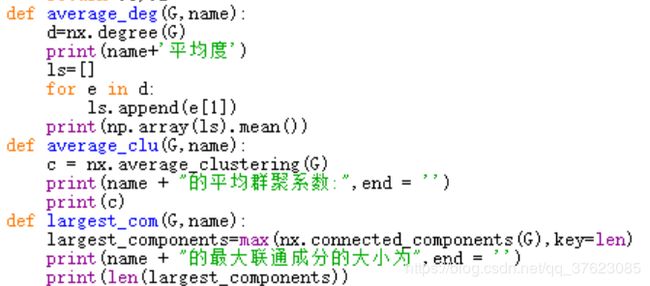
(1)对网络进行基本特性:平均度、最大联通片、群聚系数进行分析,代码如下:
(2)个人层面度分析代码:

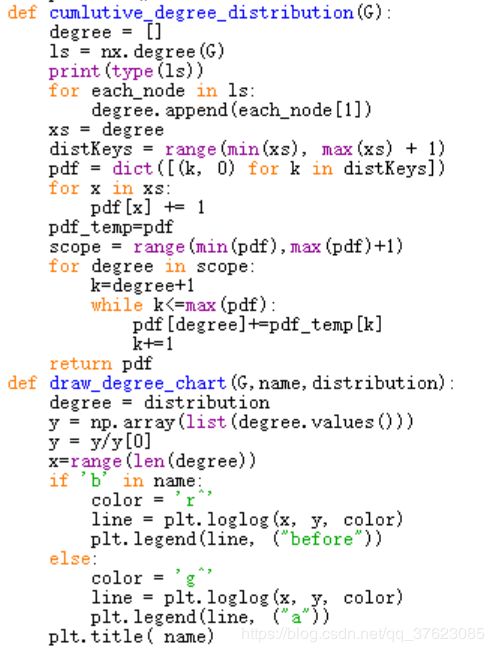
(3)累计度分析代码:
- 实验结果
1.度分析结果
(1)英语使用者的基本特性分析结果:

日语使用者的基本特性分析结果:

可见日本使用者的平均度和最大联通成分较为显著,英语使用者的平均群聚系数变化较为显著。
(2)两者的个人层面度分析结果比较:
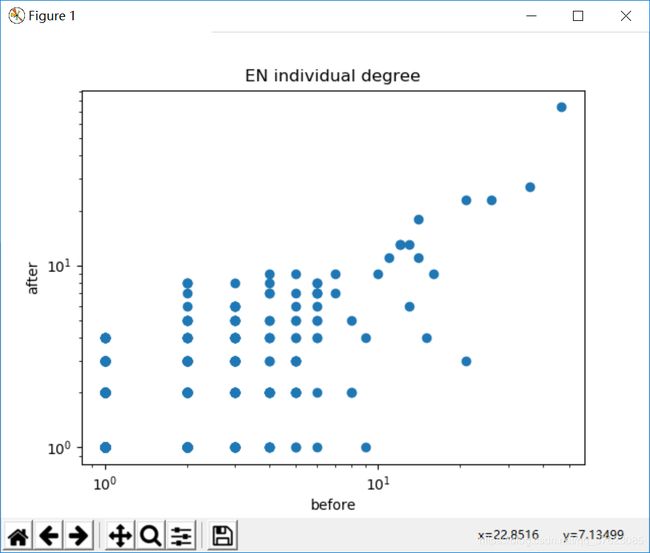
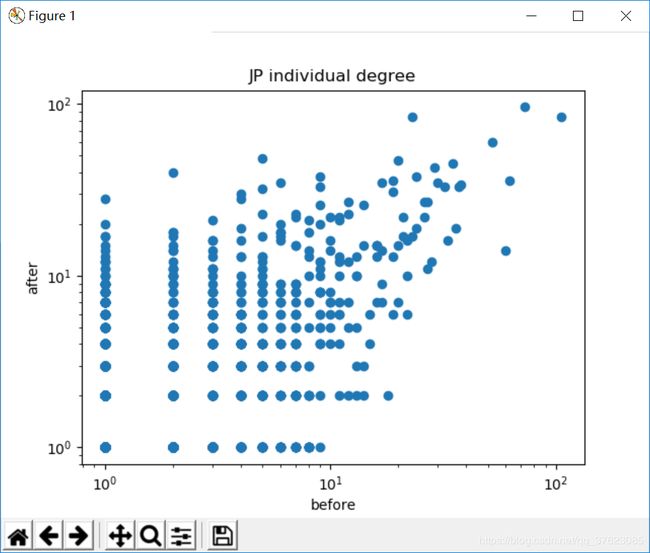
(3)累计度对比:
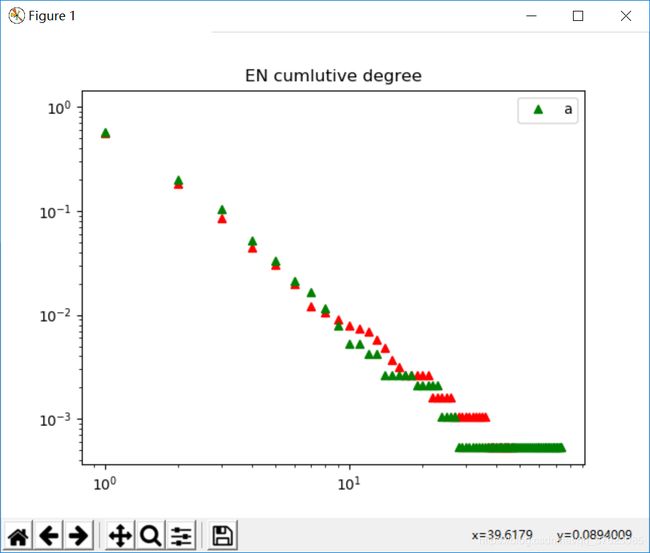

(4) 贴一张教程中的网络基本特性信息统计对比以供参考
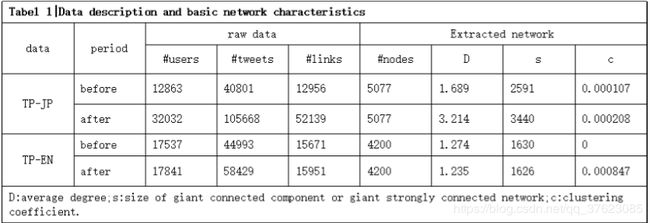
2.使用Gephi绘制图
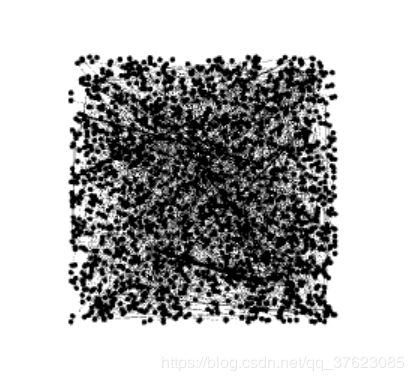
(1) 首先绘制英语使用者地震前后的图,导入之前输出的两个gml文件,注意选择无向图导入

导入之后的图长这样:
(2) 然后对其进行分类,上色,Gephi 内置快速模块化算法,可以根据网络结构对网络进行简单的社区划分。点 击网络概述板块中的“模块化”,运行 community detection 算法

社区划分后,左上角外观部分可以对检测出的社区进行颜色渲染操作。
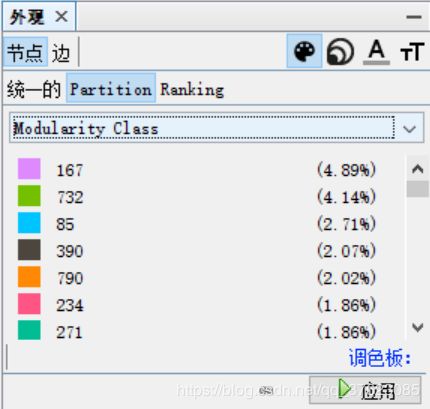
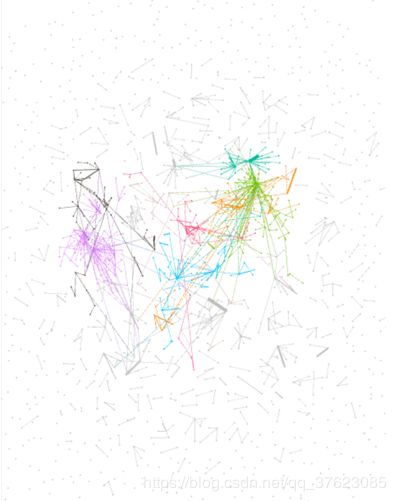
点击应用,然后在下方修改布局为OpenOrd,再次点击应用

得到的图如下:
(3) 绘制出图以后,我们可以将英语使用者,日语使用者地震前后的图绘制出来了
英语使用者地震前后的图:

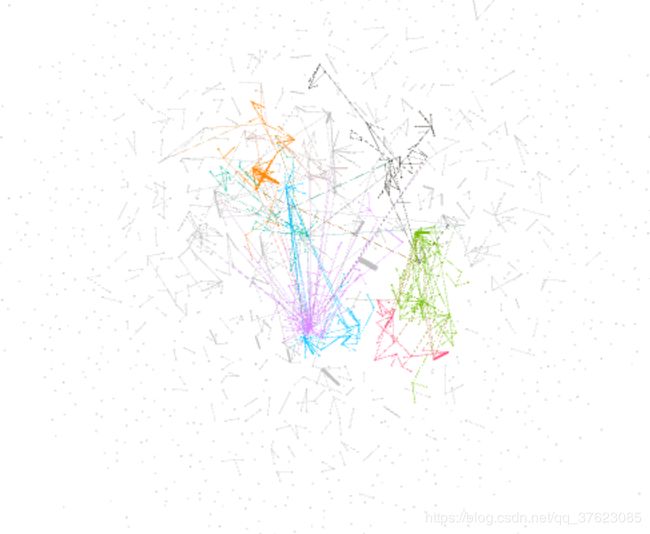
好像并没有特别明显的变化,那我们接下来看日语使用者地震前后的图:
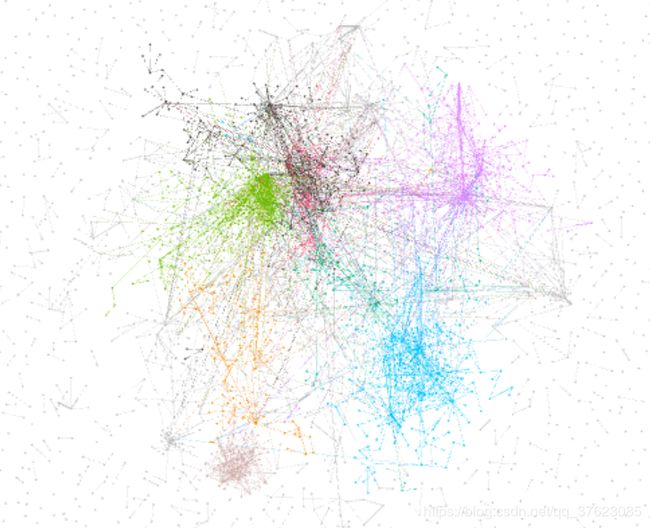

嗯,变化相当明显,可以看到地震后整个图变得灰蒙蒙一片,由此可知地震让人们的联系变得更多更杂乱。
————————————————2019.3.31———————————————一个学期过去了,把代码贴上来(下面两个.py文件都要和json文件放在同一目录下)
- ENtwitter:
import json
import networkx as nx
import numpy as np
from matplotlib import pyplot as plt
def getJson(filename):
    fp=open(filename,encoding='utf-8')
    temp=json.loads(fp.read())
    page=temp['response']['list']
    ls=[]
    for post in page:
        dic={}
        nick=post['trackback_author_nick']
        name=post['trackback_author_name']
        date=post['trackback_date']
        content=post['content']
        dic['nick']=nick
        dic['name']=name
        dic['date']=date
        dic['content']=content
        ls.append(dic)
    fp.close()
    return ls
def getAfterDict():
    ls=[]
    for i in range(1,97):
        for j in range(1,5):
            post=getJson('after'+str(10*i+j)+'.json')
            ls+=post
    print('after fin',len(ls))
    return ls
def getBeforeDict():
    ls=[]
    for i in range(1,97):
        for j in range(1,2):
            post=getJson('before'+str(10*i+j)+'.json')
            ls+=post
    print('before fin',len(ls))
    return ls
def getNet(data):
    G=nx.Graph()
    for row in range(1,len(data)):
        record=data[row]
        c_nick=record['nick']
        #添加该用户节点
        if c_nick in G.nodes():
            pass
        else:
            G.add_node(c_nick)
        content=str(record['content'])
        if content:
            while content.find('@')>=0:
                #得到被@用户的nick
                ind=content.index('@')
                n_nick=''
while content[ind]!=' 'and content[ind]!=':'and ind- JPtwitter:
import json
import networkx as nx
import numpy as np
from matplotlib import pyplot as plt
def getJson(filename):
    fp=open(filename,encoding='utf-8')
    temp=json.loads(fp.read())
    page=temp['response']['list']
    ls=[]
    for post in page:
        dic={}
        nick=post['trackback_author_nick']
        name=post['trackback_author_name']
        date=post['trackback_date']
        content=post['content']
        dic['nick']=nick
        dic['name']=name
        dic['date']=date
        dic['content']=content
        ls.append(dic)
    fp.close()
    return ls
def getAfterDict():
    ls=[]
    for i in range(1,97):
        for j in range(1,5):
            post=getJson('after'+str(10*i+j)+'.json')
            ls+=post
    print('after fin',len(ls))
    return ls
def getBeforeDict():
    ls=[]
    for i in range(1,97):
        for j in range(1,5):
            post=getJson('before'+str(10*i+j)+'.json')
            ls+=post
    print('before fin',len(ls))
    return ls
def getNet(data):
    G=nx.Graph()
    for row in range(1,len(data)):
        record=data[row]
        c_nick=record['nick']
        if c_nick in G.nodes():
            pass
        else:
            G.add_node(c_nick)
        content=str(record['content'])
        if content:
            while content.find('@')>=0:
                #得到被@的人的nick
                ind=content.index('@')
                n_nick=''
                while content[ind]!=' 'and content[ind]!=':'and ind