一、参数说明
echartr(data, x, y, , )
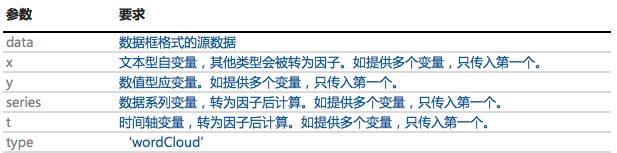
参数说明
二、数据准备
从百度热词榜获取热词,并解析为数据框,包含热词和频数。
为此构建一个函数getBaiduHot,解析百度热词趋势 网页。
getBaiduHot <- function(url, top=30, HTMLencoding=NULL){
  baiduhot <- paste0(readLines(url), collapse="")
  charset <- gsub('^.+charset=([[:alnum:]-]+?)[^[:alnum:]-].+$', "\\1",
                  baiduhot)
  if (is.null(HTMLencoding)) if (!is.null(charset)) HTMLencoding <- charset
  baiduhot <- stringr::str_conv(baiduhot, HTMLencoding)
  hotword <- gsub(".+?]+?>([^<>]+?).+?(\\d+?).+?","\\1\t\\3\t\\2\t", baiduhot)
  hotword <- enc2native(gsub("^(.+?)\t{4,}.+$","\\1", hotword))
  hotword <- t(matrix(unlist(strsplit(hotword,"\t")), nrow=3))
  hotword <- as.data.frame(hotword, stringsAsFactors=FALSE)
  names(hotword) <- c("Keyword", "Freq", "Trend")
  hotword$Freq <- as.numeric(hotword$Freq)
  hotword <- hotword[order(hotword$Freq, decreasing=TRUE),]
  return(hotword[1:top,])
}
hotword <- getBaiduHot("http://top.baidu.com/buzz?b=1", HTMLencoding='GBK')
knitr::kable(hotword)
三、图表展现
echartr(hotword,Keyword,Freq,type = 'wordCloud')

词云图
四、带时间轴的图表
- 数据处理
比较实时、今日和七日热词趋势。
首先,获取今日和七日两个榜单的网页并转为数据框,合并。
hotword$t <- 'Realtime'
hotword1 <- getBaiduHot("http://top.baidu.com/buzz?b=341&fr=topbuzz_b1",
                        HTMLencoding = 'GBK')
hotword1$t <- 'Today'
hotword2 <- getBaiduHot("http://top.baidu.com/buzz?b=42&c=513&fr=topbuzz_b341",
                        HTMLencoding = 'GBK')
hotword2$t <- '7-days'
hotword <- do.call('rbind', list(hotword, hotword1, hotword2))
hotword$t <- factor(hotword$t, levels=c('Realtime', 'Today', '7-days'))
- 图表展现
echartr(hotword, Keyword, Freq, t=t, type='wordCloud')
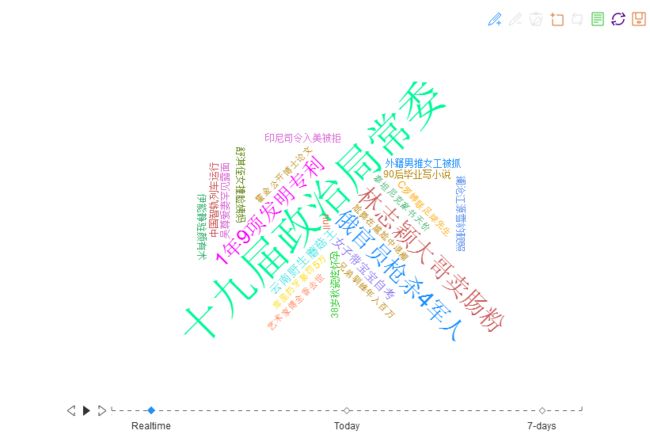
词云图
更多功能请戳官方链接:madlogos.github.io/recharts/Basic_Plots_01_Scatterplot_cn.html#-en