Matlab TreeBagger随机森林回归实例
简介
这里是一个在Matlab使用随机森林(TreeBagger)的例子。随机森林回归是一种机器学习和数据分析领域常用且有效的算法。本文介绍在Matlab平台如何使用自带函数和测试数据实现回归森林,对于随机森林和决策树的相关理论原理将不做太深入的描述。
算法流程
(1)加载Matlab测试数据集;
(2)获取计算机性能,以便最好地利用其性能;
(3)训练TreeBagger(随机森林);
(4)创建散点图;
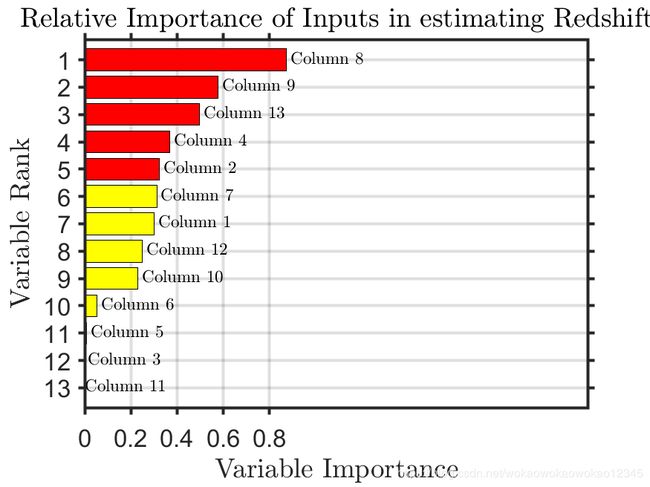
(5)估计输入变量的相对重要性;
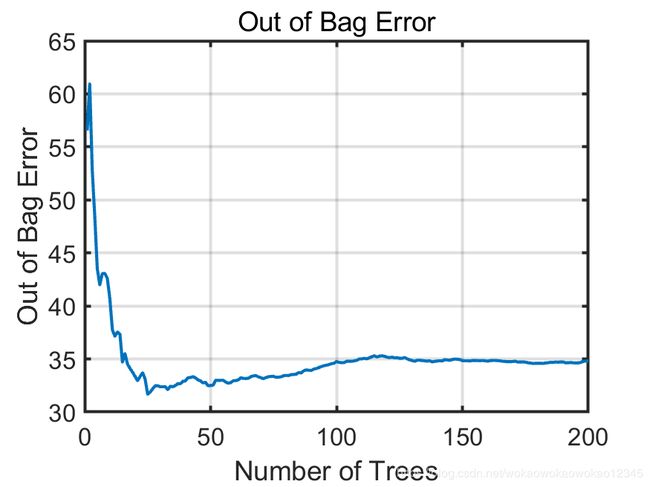
(6)检查需要多少棵树。
TreeBagger介绍
TreeBagger集成了一组决策树,用于分类或回归。集成中的每棵树都生长在独立绘制的输入数据的引导程序副本上。该副本中未包含的观察结果对于该树而言是“无用之物”。
TreeBagger将决策树用于分类或回归。TreeBagger依靠ClassificationTree和 RegressionTree功能来生长单个树。ClassificationTree和RegressionTree接受为每个决策拆分随机选择的特征数作为可选输入参数。也就是说, TreeBagger实现了随机森林算法。
对于回归问题,TreeBagger支持均值和分位数回归(即分位数回归森林)。
默认情况下,TreeBagger为分类树。要使用回归树,请指定 ‘Method’,‘regression’。
语法
Mdl = TreeBagger(NumTrees,Tbl,ResponseVarName)
Mdl = TreeBagger(NumTrees,Tbl,formula)
Mdl = TreeBagger(NumTrees,Tbl,Y)
B = TreeBagger(NumTrees,X,Y)
B = TreeBagger(NumTrees,X,Y,Name,Value)
描述
Y是响应数据的数组,对于分类问题, Y是一组类标签。标签可以是数字或逻辑向量等。对于回归问题,Y是一个数值向量。要增长回归树,必须指定名称-值对 ‘Method’,‘regression’。
若要预测均值响应或估计给定数据的均方误差,请分别传递TreeBagger模型和数据分析。要对袋外观测数据执行类似的操作,请使用oobPredict或oobError。
要估计给定数据的响应分布的分位数或分位数误差,请将TreeBagger模型和数据分别传递给quantilePredict或quantileError。要对袋外观察执行类似的操作,请使用oobQuantilePredict或oobError。
测试数据集下载
https://download.csdn.net/download/wokaowokaowokao12345/12243422
例子1
例子2
%--------------------------------------------------------------------------
clear;clc;close all

%--------------------------------------------------------------------------
% 加载Matlab提供的测试数据,备注:house_dataset数据集新版Matlab没有
% 如果需要这个数据集可以在我csdn资源中下载:https://download.csdn.net/download/wokaowokaowokao12345/12243422

% load house_dataset
% In = houseInputs';
% Out = houseTargets';
% house_dataset.csv数据可以在我csdn资源中心下载
load house_dataset.csv
In = house_dataset(:,2:end);
Out = house_dataset(:,1);

%下面测试数据可以直接在2018版本Matlab中加载
% load imports-85;
% Out = X(:,1);
% In = X(:,2:end);

%--------------------------------------------------------------------------
% Find capabilities of computer so we can best utilize them.
% 获取计算机性能,这部分内容可以注释掉
% Find if gpu is present
ngpus=gpuDeviceCount;
disp([num2str(ngpus) ' GPUs found'])
if ngpus>0
    lgpu=1;
    disp('GPU found')
    useGPU='yes';
else
    lgpu=0;
    disp('No GPU found')
    useGPU='no';
end

% Find number of cores
ncores=feature('numCores');
disp([num2str(ncores) ' cores found'])

% Find number of cpus
import java.lang.*;
r=Runtime.getRuntime;
ncpus=r.availableProcessors;
disp([num2str(ncpus) ' cpus found'])

if ncpus>1
    useParallel='yes';
else
    useParallel='no';
end

[archstr,maxsize,endian]=computer;
disp([...
    'This is a ' archstr ...
    ' computer that can have up to ' num2str(maxsize) ...
    ' elements in a matlab array and uses ' endian ...
    ' byte ordering.'...
    ])

% Set up the size of the parallel pool if necessary
npool=ncores;

% Opening parallel pool
if ncpus>1
    tic
    disp('Opening parallel pool')

    % first check if there is a current pool
    poolobj=gcp('nocreate');

    % If there is no pool create one
    if isempty(poolobj)
        command=['parpool(' num2str(npool) ');'];
        disp(command);
        eval(command);
    else
        poolsize=poolobj.NumWorkers;
        disp(['A pool of ' poolsize ' workers already exists.'])
    end

    % Set parallel options
    paroptions = statset('UseParallel',true);
    toc

end

%--------------------------------------------------------------------------
%训练随机森林,TreeBagger使用内容,以及设置随机森林参数
tic
leaf=5;
ntrees=200;
fboot=1;
surrogate='on';
disp('Training the tree bagger')
b = TreeBagger(...
        ntrees,...
        In,Out,...
        'Method','regression',...
        'oobvarimp','on',...
        'surrogate',surrogate,...
        'minleaf',leaf,...
        'FBoot',fboot,...
        'Options',paroptions...
    );
toc

%--------------------------------------------------------------------------
% Estimate Output using tree bagger
%使用训练好的模型进行预测
disp('Estimate Output using tree bagger')
x=Out;
y=predict(b, In);
name='Bagged Decision Trees Model';
toc

%--------------------------------------------------------------------------
% calculate the training data correlation coefficient
%计算相关系数
cct=corrcoef(x,y);
cct=cct(2,1);

%--------------------------------------------------------------------------
% Create a scatter Diagram
disp('Create a scatter Diagram')

% plot the 1:1 line
plot(x,x,'LineWidth',3);

hold on
scatter(x,y,'filled');
hold off
grid on

set(gca,'FontSize',18)
xlabel('Actual','FontSize',25)
ylabel('Estimated','FontSize',25)
title(['Training Dataset, R^2=' num2str(cct^2,2)],'FontSize',30)

drawnow

fn='ScatterDiagram';
fnpng=[fn,'.png'];
print('-dpng',fnpng);

%--------------------------------------------------------------------------
% Calculate the relative importance of the input variables
tic
disp('Sorting importance into descending order')
weights=b.OOBPermutedVarDeltaError;
[B,iranked] = sort(weights,'descend');
toc

%--------------------------------------------------------------------------
disp(['Plotting a horizontal bar graph of sorted labeled weights.'])

%--------------------------------------------------------------------------
figure
barh(weights(iranked),'g');
xlabel('Variable Importance','FontSize',30,'Interpreter','latex');
ylabel('Variable Rank','FontSize',30,'Interpreter','latex');
title(...
    ['Relative Importance of Inputs in estimating Redshift'],...
    'FontSize',17,'Interpreter','latex'...
    );
hold on
barh(weights(iranked(1:10)),'y');
barh(weights(iranked(1:5)),'r');

%--------------------------------------------------------------------------
grid on
xt = get(gca,'XTick');
xt_spacing=unique(diff(xt));
xt_spacing=xt_spacing(1);
yt = get(gca,'YTick');
ylim([0.25 length(weights)+0.75]);
xl=xlim;
xlim([0 2.5*max(weights)]);

%--------------------------------------------------------------------------
% Add text labels to each bar
for ii=1:length(weights)
    text(...
        max([0 weights(iranked(ii))+0.02*max(weights)]),ii,...
        ['Column ' num2str(iranked(ii))],'Interpreter','latex','FontSize',11);
end

%--------------------------------------------------------------------------
set(gca,'FontSize',16)
set(gca,'XTick',0:2*xt_spacing:1.1*max(xl));
set(gca,'YTick',yt);
set(gca,'TickDir','out');
set(gca, 'ydir', 'reverse' )
set(gca,'LineWidth',2);
drawnow

%--------------------------------------------------------------------------
fn='RelativeImportanceInputs';
fnpng=[fn,'.png'];
print('-dpng',fnpng);

%--------------------------------------------------------------------------
% Ploting how weights change with variable rank
disp('Ploting out of bag error versus the number of grown trees')

figure
plot(b.oobError,'LineWidth',2);
xlabel('Number of Trees','FontSize',30)
ylabel('Out of Bag Error','FontSize',30)
title('Out of Bag Error','FontSize',30)
set(gca,'FontSize',16)
set(gca,'LineWidth',2);
grid on
drawnow
fn='EroorAsFunctionOfForestSize';
fnpng=[fn,'.png'];
print('-dpng',fnpng);


