python 逻辑回归二元分类预测Titanic生存率
项目源码请见:https://github.com/dennis0818/Titanic-survival-prediction
一 项目简介
泰坦尼克号的沉没是历史上最为著名的海难之一。1912年4月15日,泰坦尼克号在其首次航行中,与冰山相撞,最终沉没。在2224名乘客和机组人员中,有1502人遇难。这一耸人听闻的灾难震惊了当时的国际社会,并督促人们完善海上安全法则。
导致这次事故死亡率如此之高的一个重要原因是,泰坦尼克号上并没有为船上乘客和机组人员准备足够的救生船。虽然在沉船事件中幸存下来也有一些运气的因素,但有些人比其他人更有可能幸存下来,比如妇女、儿童和上层阶级。
泰坦尼克号的事故曾由著名导演詹姆斯.卡梅隆于1997年拍摄成电影,电影用影视特效逼真的还原了泰坦尼克号遇难的经过,并把影片两位主角Jack和Rose之间的爱情故事深深的刻在了人们心中。
二 分析目标
- Jack和Rose是否确有其人
- 泰坦尼克号的幸存者是否存在某些规律
- 简单建模并预测部分人的生还
三 数据来源
本数据来自kaggle数据竞赛的新手赛题。数据如下:
- train.csv 包含真实结果的训练数据集
- test.csv 用于检验模型的测试数据集
四 数据分析
1 字段表
字 段 表
| Variable | Definition | Key |
|---|---|---|
| survival | 是否生还 | 0 = No, 1 = Yes |
| pclass | 几等票 | 1 = 1st,2 = 2nd,3 = 3rd |
| sex | 性别 | |
| age | 年龄 | |
| sibsp | 上船的兄弟姐妹/配偶数量 | |
| parch | 上船的父母/小孩的数量 | |
| ticket | 船票号 | |
| fare | 花费 | |
| cabin | 船舱号 | |
| embarked | 登船港口 | C = Cherbourg, Q = Queenstown, S = Southampton |
2 数据分析
import numpy as np
import pandas as pd
import matplotlib.pyplot as plt
import seaborn as sns
import re
from sklearn.linear_model import LogisticRegression
from sklearn.linear_model import LogisticRegressionCV
from sklearn.tree import DecisionTreeClassifier

%matplotlib inline
titanic_train = pd.read_csv('D:/Python/exercise/samples/titanic/train.csv')
titanic_test = pd.read_csv('D:/Python/exercise/samples/titanic/test.csv')
titanic_train.shape
(891, 12)
titanic_train.groupby('Sex').size()
Sex
female    314
male      577
dtype: int64
titanic_train.head()
| PassengerId | Survived | Pclass | Name | Sex | Age | SibSp | Parch | Ticket | Fare | Cabin | Embarked | |
|---|---|---|---|---|---|---|---|---|---|---|---|---|
| 0 | 1 | 0 | 3 | Braund, Mr. Owen Harris | male | 22.0 | 1 | 0 | A/5 21171 | 7.2500 | NaN | S |
| 1 | 2 | 1 | 1 | Cumings, Mrs. John Bradley (Florence Briggs Th... | female | 38.0 | 1 | 0 | PC 17599 | 71.2833 | C85 | C |
| 2 | 3 | 1 | 3 | Heikkinen, Miss. Laina | female | 26.0 | 0 | 0 | STON/O2. 3101282 | 7.9250 | NaN | S |
| 3 | 4 | 1 | 1 | Futrelle, Mrs. Jacques Heath (Lily May Peel) | female | 35.0 | 1 | 0 | 113803 | 53.1000 | C123 | S |
| 4 | 5 | 0 | 3 | Allen, Mr. William Henry | male | 35.0 | 0 | 0 | 373450 | 8.0500 | NaN | S |
titanic_train.isnull().sum()
PassengerId      0
Survived         0
Pclass           0
Name             0
Sex              0
Age            177
SibSp            0
Parch            0
Ticket           0
Fare             0
Cabin          687
Embarked         2
dtype: int64
首先就是我非常关心的,Jack和Rose是否确有其人。
电影中,Rose的原名是Rose Dewitt Bukater,但后来Jack死了,Rose把Jack当成了自己的丈夫,Jack的原名叫Jack Dawson,所以Rose就说自己叫Rose Dawson。用正则表达式分别在train和test数据集中查找
pattern = r'rose|jack'
regex = re.compile(pattern, flags = re.IGNORECASE)
titanic_train[titanic_train['Name'].str.contains(pattern, flags = re.IGNORECASE)]
| PassengerId | Survived | Pclass | Name | Sex | Age | SibSp | Parch | Ticket | Fare | Cabin | Embarked | |
|---|---|---|---|---|---|---|---|---|---|---|---|---|
| 72 | 73 | 0 | 2 | Hood, Mr. Ambrose Jr | male | 21.0 | 0 | 0 | S.O.C. 14879 | 73.50 | NaN | S |
| 766 | 767 | 0 | 1 | Brewe, Dr. Arthur Jackson | male | NaN | 0 | 0 | 112379 | 39.60 | NaN | C |
| 855 | 856 | 1 | 3 | Aks, Mrs. Sam (Leah Rosen) | female | 18.0 | 0 | 1 | 392091 | 9.35 | NaN | S |
titanic_test[titanic_test['Name'].str.contains(pattern, flags = re.IGNORECASE)]
| PassengerId | Pclass | Name | Sex | Age | SibSp | Parch | Ticket | Fare | Cabin | Embarked | |
|---|---|---|---|---|---|---|---|---|---|---|---|
| 208 | 1100 | 1 | Rosenbaum, Miss. Edith Louise | female | 33.0 | 0 | 0 | PC 17613 | 27.7208 | A11 | C |
| 327 | 1219 | 1 | Rosenshine, Mr. George (Mr George Thorne")" | male | 46.0 | 0 | 0 | PC 17585 | 79.2000 | NaN | C |
从匹配结果来看,只能相信本故事情节确实纯属虚构
接下来看一下票的等级“Pclass”代表什么
titanic_train.pivot_table('PassengerId', index = 'Pclass', columns = 'Sex', aggfunc = len, margins = True)
| Sex | female | male | All |
|---|---|---|---|
| Pclass | |||
| 1 | 94 | 122 | 216 |
| 2 | 76 | 108 | 184 |
| 3 | 144 | 347 | 491 |
| All | 314 | 577 | 891 |
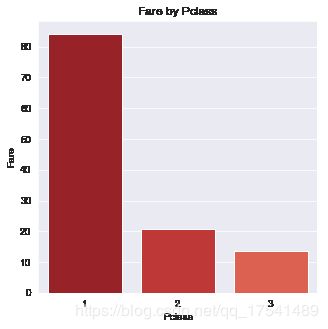
class_fare = titanic_train.groupby('Pclass')['Fare'].mean()
class_fare
Pclass
1    84.154687
2    20.662183
3    13.675550
Name: Fare, dtype: float64
似乎等级越高越能花钱
fig = plt.figure(figsize = (5,5))
sns.set_style('darkgrid')
sns.barplot(x = class_fare.index.values, y = class_fare.values, palette = sns.color_palette('Reds_r'))
plt.xlabel('Pclass')
plt.ylabel('Fare')
plt.title('Fare by Pclass')
Text(0.5, 1.0, 'Fare by Pclass')
class_surv = titanic_train.groupby('Pclass')['Survived'].mean()
class_surv
Pclass
1    0.629630
2    0.472826
3    0.242363
Name: Survived, dtype: float64
fig, ax = plt.subplots(1, 2, figsize = (12, 5))
sns.set_style('darkgrid')
sns.barplot(x = 'Pclass', y = 'Survived', data = titanic_train, ax = ax[0])
sns.barplot(x = 'Pclass', y = 'Survived', hue = 'Sex', data = titanic_train, ax = ax[1], palette = sns.color_palette(['dodgerblue', 'magenta']))
ax[0].set_title('Survived by Pclass')
Text(0.5, 1.0, 'Survived by Pclass')
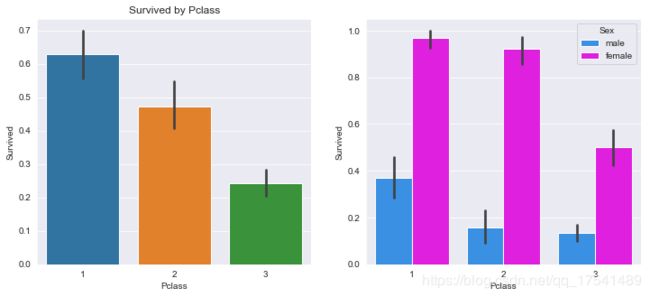
从上图中可以看出,越是上层阶级越容易活命(电影中富人与穷人收到了不公平的对待,穷人被铁门拦住而富人们则早早上了救生艇),越是女人越容易活命(也正如电影里演的,救生船有限的情况下,妇人和小孩儿被安排最先上救生船,但依然有阶级区别)
从总体情况看,女人比男人得到了更多获救的机会,对比如下:
titanic_train.groupby('Sex')['Survived'].mean()
Sex
female    0.742038
male      0.188908
Name: Survived, dtype: float64
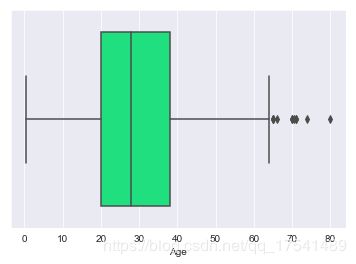
从年龄方面进行分析,首先来看看年龄的分布
sns.boxplot(x = 'Age', data = titanic_train, color = 'springgreen')
print('the max age is: {}'.format(titanic_train.Age.max()), 'the minimum age is: {}'.format(titanic_train.Age.min()))
the max age is: 80.0 the minimum age is: 0.42
bins = np.arange(0,81,10)
bins #年龄区间
array([ 0, 10, 20, 30, 40, 50, 60, 70, 80])
cats = pd.cut(titanic_train['Age'], bins)
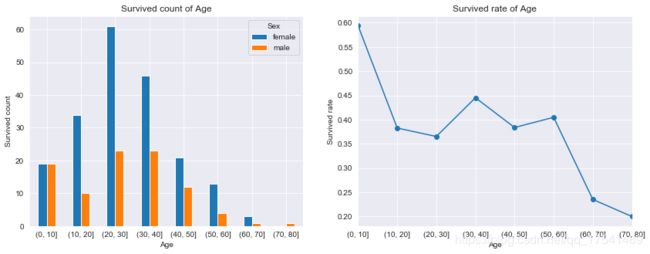
age_surv_sex = titanic_train.groupby([cats, 'Sex'])['Survived'].sum().unstack(level=1)
age_surv_sex
| Sex | female | male |
|---|---|---|
| Age | ||
| (0, 10] | 19.0 | 19.0 |
| (10, 20] | 34.0 | 10.0 |
| (20, 30] | 61.0 | 23.0 |
| (30, 40] | 46.0 | 23.0 |
| (40, 50] | 21.0 | 12.0 |
| (50, 60] | 13.0 | 4.0 |
| (60, 70] | 3.0 | 1.0 |
| (70, 80] | NaN | 1.0 |
titanic_train['age_cats'] = cats.astype(str)
titanic_train.pivot_table('PassengerId', index = 'age_cats', columns = ['Sex', 'Survived'], aggfunc = len, margins = True)
| Sex | female | male | All | ||
|---|---|---|---|---|---|
| Survived | 0 | 1 | 0 | 1 | |
| age_cats | |||||
| (0.0, 10.0] | 12.0 | 19.0 | 14.0 | 19.0 | 64 |
| (10.0, 20.0] | 12.0 | 34.0 | 59.0 | 10.0 | 115 |
| (20.0, 30.0] | 20.0 | 61.0 | 126.0 | 23.0 | 230 |
| (30.0, 40.0] | 9.0 | 46.0 | 77.0 | 23.0 | 155 |
| (40.0, 50.0] | 10.0 | 21.0 | 43.0 | 12.0 | 86 |
| (50.0, 60.0] | 1.0 | 13.0 | 24.0 | 4.0 | 42 |
| (60.0, 70.0] | NaN | 3.0 | 13.0 | 1.0 | 17 |
| (70.0, 80.0] | NaN | NaN | 4.0 | 1.0 | 5 |
| nan | 17.0 | 36.0 | 108.0 | 16.0 | 177 |
| All | 81.0 | 233.0 | 468.0 | 109.0 | 891 |
age_surv = titanic_train.groupby(cats)['Survived'].mean()
age_grouped = titanic_train.groupby(cats).size()
fig, ax = plt.subplots(1,2,figsize=(14,5))
sns.set_style('darkgrid')
age_surv_sex.plot.bar(ax = ax[0], rot = 360)
ax[0].set_title('Survived count of Age')
ax[0].set_ylabel('Survived count')

age_surv.plot.line(ax = ax[1], marker = 'o')
plt.ylabel('Survived rate')
plt.title('Survived rate of Age')
Text(0.5, 1.0, 'Survived rate of Age')
从上图可以看到,0-10岁的小孩有60%获救,其次是30-40岁的人有45%获救,70-80岁的人获救率最低
3 数据规整
用中位数填充年龄的缺失值
mid = titanic_train['Age'].median()
age = titanic_train['Age'].fillna(mid)
age_test = titanic_test['Age'].fillna(mid)
titanic_train['Age'] = age
titanic_test['Age'] = age_test
“titanic_train”和“titanic_test”表中的“sex”列是字符类型,不便于计算,需要转换为数字。用1代表男性,0代表女性,新加入“ismale”列
ismale = (titanic_train['Sex'] == 'male').astype(int)
ismale_test = (titanic_test['Sex'] == 'male').astype(int)
titanic_train['ismale'] = ismale
titanic_test['ismale'] = ismale_test
titanic_train.head()
| PassengerId | Survived | Pclass | Name | Sex | Age | SibSp | Parch | Ticket | Fare | Cabin | Embarked | age_cats | ismale | |
|---|---|---|---|---|---|---|---|---|---|---|---|---|---|---|
| 0 | 1 | 0 | 3 | Braund, Mr. Owen Harris | male | 22.0 | 1 | 0 | A/5 21171 | 7.2500 | NaN | S | (20.0, 30.0] | 1 |
| 1 | 2 | 1 | 1 | Cumings, Mrs. John Bradley (Florence Briggs Th... | female | 38.0 | 1 | 0 | PC 17599 | 71.2833 | C85 | C | (30.0, 40.0] | 0 |
| 2 | 3 | 1 | 3 | Heikkinen, Miss. Laina | female | 26.0 | 0 | 0 | STON/O2. 3101282 | 7.9250 | NaN | S | (20.0, 30.0] | 0 |
| 3 | 4 | 1 | 1 | Futrelle, Mrs. Jacques Heath (Lily May Peel) | female | 35.0 | 1 | 0 | 113803 | 53.1000 | C123 | S | (30.0, 40.0] | 0 |
| 4 | 5 | 0 | 3 | Allen, Mr. William Henry | male | 35.0 | 0 | 0 | 373450 | 8.0500 | NaN | S | (30.0, 40.0] | 1 |
4 预测
从前面的数据分析看来,“Pclass”、“Age”、“ismale”这三个属性与是否幸存关系比较密切,因此选取这三列数作为自变量建模
pick = ['Pclass', 'Age', 'ismale']
x_train = titanic_train[pick].values
y_train = titanic_train['Survived'].values
x_test = titanic_test[pick].values
这是一个分类问题,采用scikit-learn的逻辑回归模型
model = LogisticRegression()
训练模型
model.fit(x_train, y_train)
D:\ProgramData\lib\site-packages\sklearn\linear_model\logistic.py:433: FutureWarning: Default solver will be changed to 'lbfgs' in 0.22. Specify a solver to silence this warning.
  FutureWarning)


LogisticRegression(C=1.0, class_weight=None, dual=False, fit_intercept=True,
          intercept_scaling=1, max_iter=100, multi_class='warn',
          n_jobs=None, penalty='l2', random_state=None, solver='warn',
          tol=0.0001, verbose=0, warm_start=False)
y_predict = model.predict(x_train)
model.intercept_
array([3.88051905])
model.coef_
array([[-0.98136537, -0.023991 , -2.40629309]])
(y_predict == y_train).mean()
0.7968574635241302
现在准备用训练好的模型预测数据
y_esti = model.predict(x_test)
titanic_test['Survived'] = y_esti
submit = titanic_test[['PassengerId', 'Survived']]
用K-近邻模型
from sklearn.neighbors import KNeighborsClassifier
k_neighbor = KNeighborsClassifier(n_neighbors = 12)
k_neighbor.fit(x_train, y_train)
KNeighborsClassifier(algorithm='auto', leaf_size=30, metric='minkowski',
           metric_params=None, n_jobs=None, n_neighbors=12, p=2,
           weights='uniform')
y_esti_k = k_neighbor.predict(x_test)
titanic_test['Survived'] = y_esti_k
submit_k_02 = titanic_test[['PassengerId', 'Survived']]
#submit_k_02.to_excel('D:/python/practise/sample/titanic/submit/submit_k_02.xlsx')
输出结果集并提交给Kaggle评分
#submit.to_excel('D:/Python/exercise/samples/titanic/submit_01.xlsx')
from IPython.display import Image
Image(filename = 'C:/Users/24866/score.png')
1为满分,有以上三个变量建模预测的最高分是0.76左右,正确率还不算太理想
用更多的特征变量进行拟合加入SibSp、Parch、Fare三个变量
pick_more = ['Pclass', 'Age', 'ismale', 'SibSp', 'Parch', 'Fare']
titanic_test[pick_more].isnull().sum()
Pclass    0
Age       0
ismale    0
SibSp     0
Parch     0
Fare      1
dtype: int64
titanic_train[pick_more].isnull().sum()
Pclass    0
Age       0
ismale    0
SibSp     0
Parch     0
Fare      0
dtype: int64
sibsp = titanic_train['SibSp']
titanic_train.groupby('SibSp')['Survived'].mean()
SibSp
0    0.345395
1    0.535885
2    0.464286
3    0.250000
4    0.166667
5    0.000000
8    0.000000
Name: Survived, dtype: float64
SibSp与生存率的关系
fig, ax = plt.subplots(1,2,figsize=(14,5))
sns.set_style('darkgrid')
titanic_train.groupby('SibSp')['Survived'].sum().plot.bar(ax = ax[0], rot = 360)
ax[0].set_title('Survived count of SibSp')
ax[0].set_ylabel('Survived count')

titanic_train.groupby('SibSp')['Survived'].mean().plot.line(ax = ax[1], marker = 'o')
plt.ylabel('Survived rate')
plt.title('Survived rate of SibSp')
Text(0.5, 1.0, 'Survived rate of SibSp')
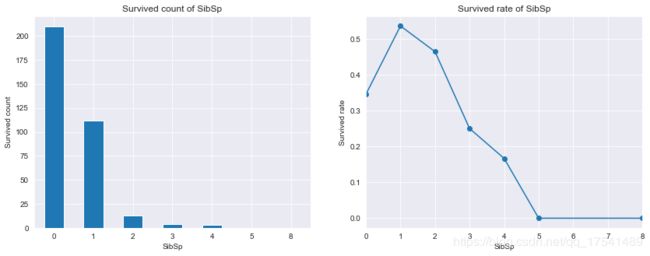
从数量上看,兄弟姐妹越少获救的人数越多,获救的比率中,有一个兄弟姐妹的人获救比例最高,有5-8个兄弟姐妹的人获救比例接近0
Parch与生存率的关系
sibsp = titanic_train['Parch']
titanic_train.groupby('Parch')['Survived'].mean()
Parch
0    0.343658
1    0.550847
2    0.500000
3    0.600000
4    0.000000
5    0.200000
6    0.000000
Name: Survived, dtype: float64
fig, ax = plt.subplots(1,2,figsize=(14,5))
sns.set_style('darkgrid')
titanic_train.groupby('Parch')['Survived'].sum().plot.bar(ax = ax[0], rot = 360)
ax[0].set_title('Survived count of Parch')
ax[0].set_ylabel('Survived count')

titanic_train.groupby('Parch')['Survived'].mean().plot.line(ax = ax[1], marker = 'o')
plt.ylabel('Survived rate')
plt.title('Survived rate of Parch')
Text(0.5, 1.0, 'Survived rate of Parch')
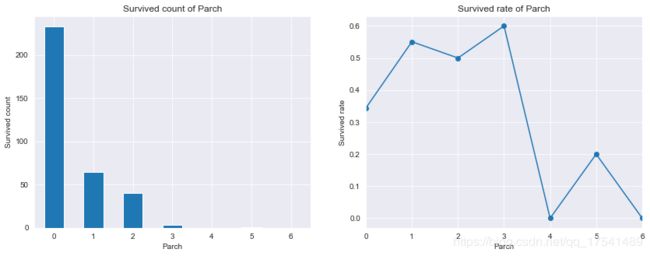
没有与亲人上船的人获救数量最多,然后依次是1、2、3个亲人,4个以上亲人的获救数量很少,从生存率上看有3个亲人的获救比例最高
亲人总数(SibSp与Parch之和)与生存率的关系
family = titanic_train
family['family'] = family['SibSp'] + family['Parch']
fig, ax = plt.subplots(1,2,figsize=(18,5))
sns.set_style('darkgrid')
family.groupby('family')['Survived'].sum().plot.bar(ax = ax[0], rot = 360)
ax[0].set_title('Survived count of Parch')
ax[0].set_ylabel('Survived count')

family.groupby('family')['Survived'].mean().plot.line(ax = ax[1], marker = 'o')
plt.ylabel('Survived rate')
plt.title('Survived rate of Parch')
Text(0.5, 1.0, 'Survived rate of Parch')

从图中可以看出,上船亲人总数越少获生存数量越高,有3个亲人在船上的人生存率最高,7个以上的无一生存
Fare(消费)与生存率的关系
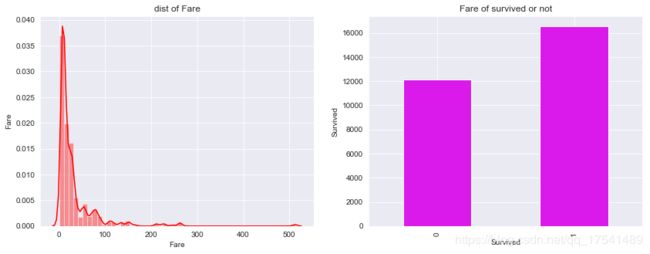
print('max : {}'.format(titanic_train['Fare'].max()), 'min : {}'.format(titanic_train['Fare'].min()))
max : 512.3292 min : 0.0
最高消费500多,最低无消费,消费数额直方图和生存与否的消费总额如下图:
fig, ax = plt.subplots(1,2,figsize=(14,5))
sns.distplot(titanic_train['Fare'], color = 'r', ax = ax[0])
ax[0].set_title('dist of Fare')
ax[0].set_ylabel('Fare')

titanic_train.groupby('Survived')['Fare'].sum().plot.bar(ax = ax[1], color = '#DA1AEB')
ax[1].set_title('Fare of survived or not')
ax[1].set_ylabel('Survived')
Text(0, 0.5, 'Survived')
可以看出大部分人消费都不高,普遍在0-50之间,为获救的人总消费低于获救的人
消费数额与生存数量及生存率的关系如下图:
cats_fare = pd.qcut(titanic_train['Fare'], 20)
fare_surv = titanic_train.groupby(cats_fare)['Survived']
fig, ax = plt.subplots(1,2,figsize=(20,5))
sns.set_style('darkgrid')
fare_surv.sum().plot.bar(ax = ax[0], rot = 360)
ax[0].set_title('Survived count of Parch')
ax[0].set_ylabel('Survived count')

fare_surv.mean().plot.line(ax = ax[1], marker = 'o')
plt.ylabel('Survived rate')
plt.title('Survived rate of Parch')
Text(0.5, 1.0, 'Survived rate of Parch')
经过分析SibSp,Parch和Fare这三项与生存率存在一定关系
下面加入这三项特征变量再进行预测,先生成训练数据集再加入多项式
x_train_more = titanic_train[pick_more].values
y_train_more = y_train
x_test_more = titanic_test[pick_more]
x_test_more = x_test_more.fillna(0).values
def gen_polynomial(x, power): #生成多项式
    p = x[:,0].reshape((len(x), 1))
    a = x[:,1].reshape((len(x), 1))
    s = x[:,2].reshape((len(x), 1))
    for i in range(2, power + 1):
        for j in range(i + 1):
            for k in range(i - j + 1):
                #print(f'{j}{k}{i-j-k}')
                add = (p**j) * (a**k) * (s**(i-j-k))
                x = np.concatenate([x, add], axis = 1)
    return x
x_train_poly = gen_polynomial(x_train_more, 2)
x_test_poly = gen_polynomial(x_test_more, 2)
x_train_poly.shape
x_test_poly.shape
model_more = LogisticRegression()
model_more.fit(x_train_poly, y_train_more)
y_esti_more = model_more.predict(x_test_poly)
y_predict_more = model_more.predict(x_train_poly)
(y_predict_more == y_train_more).mean()
titanic_test['Survived'] = y_esti_more
submit_more_01 = titanic_test[['PassengerId', 'Survived']]
#submit_more_01.to_excel('D:/python/practise/sample/titanic/submit/submit_more_02.xlsx')
Image(filename = 'C:/Users/24866/kaggle_best_01.png')
再用LogisticRegressionCV模型交叉验证选择正则化参数,进行拟合
model_cv = LogisticRegressionCV(penalty = 'l1', solver = 'liblinear')
model_cv.fit(x_train_poly, y_train_more)
y_esti_more_cv = model_more.predict(x_test_poly)
y_predict_more_cv = model_more.predict(x_train_poly)
(y_predict_more_cv == y_train_more).mean()
titanic_test['Survived'] = y_esti_more_cv
submit_more_cv_01 = titanic_test[['PassengerId', 'Survived']]
#submit_more_cv_01.to_excel('D:/python/practise/sample/titanic/submit/submit_more_cv_02.xlsx')
因为特征多为不连续,所以用决策树算法试试
tree = DecisionTreeClassifier(random_state = 0, max_depth = 6)
tree.fit(x_train_more, y_train_more)
y_esti_tree_01 = tree.predict(x_test_more)
titanic_test['Survived'] = y_esti_tree_01
submit_tree_01 = titanic_test[['PassengerId', 'Survived']]
#submit_tree_01.to_excel('D:/python/practise/sample/titanic/submit/submit_tree_04.xlsx')
pick_most = ['Pclass', 'Age', 'ismale', 'SibSp', 'Parch', 'Fare', 'Embarked']
x_train_most = titanic_train[pick_most]
s = x_train_most['Embarked'].map({'S': 1, 'C': 2, 'Q': 3})
x_train_most['Embarked'] = s
x_train_most = x_train_most.fillna(1).values
x_test_most = titanic_test[pick_most].fillna(0)
x_test_most['Embarked'] = x_test_most['Embarked'].map({'S': 1, 'C': 2, 'Q': 3})
x_test_most = x_test_most.values
变量值依然离散,可以用决策树预测
tree = DecisionTreeClassifier(random_state = 0, max_depth = 7)
tree.fit(x_train_most, y_train_more)
y_esti_tree_02 = tree.predict(x_test_most)
titanic_test['Survived'] = y_esti_tree_02
submit_tree_most_01 = titanic_test[['PassengerId', 'Survived']]
#submit_tree_most_01.to_excel('D:/python/practise/sample/titanic/submit/submit_tree_most_02.xlsx')
x_train_poly_most = gen_polynomial(x_train_most, 2)
x_test_poly_most = gen_polynomial(x_test_most, 2)
model_most = LogisticRegression()
model_most.fit(x_train_poly_most, y_train_more)
y_esti_most = model_most.predict(x_test_poly_most)
titanic_test['Survived'] = y_esti_most
submit__most_01 = titanic_test[['PassengerId', 'Survived']]
#submit__most_01.to_excel('D:/python/practise/sample/titanic/submit/submit_most_01.xlsx')
结果0.775
五 结论
- 在泰坦尼克号所有乘客中,越是上层阶级幸存的人数越多。
- 正如电影中讲述的,最后时刻,在救生艇有限的情况下,女人和小孩优先登上了救生艇。
- 采用普通逻辑回归模型加入多项式和所有变量对测试数据进行了预测,最终评分0.78左右,排名5000超过半数,可以再发掘更好的模型提高
