模拟退火 python
TSP +模拟退火
hello hello 依旧是一只努力进化的小白
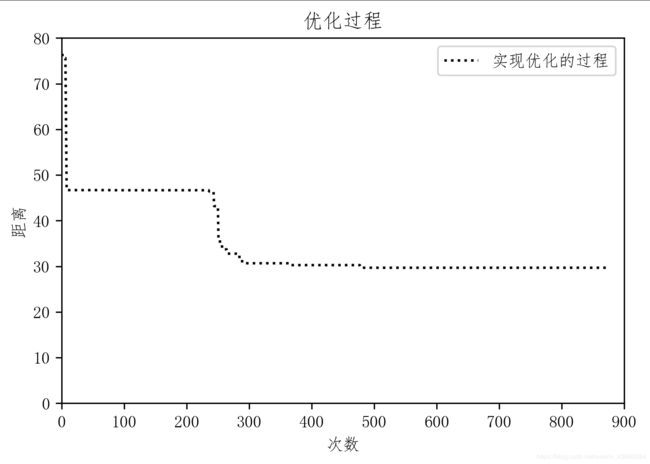
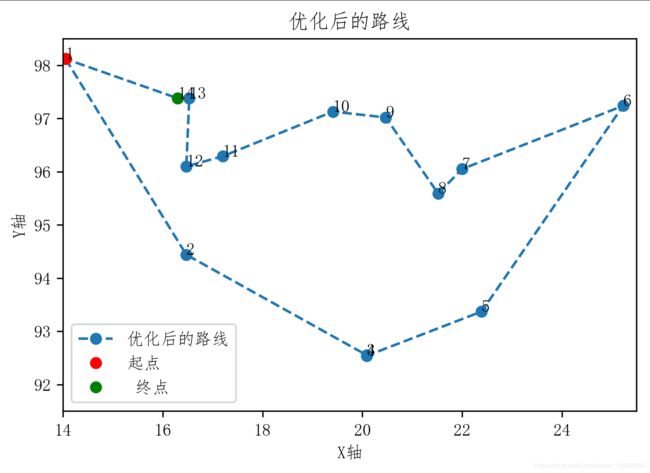
效果图:


#!/usr/bin/python3
import sys
import math
import random
import matplotlib.pyplot as plt
import pylab as pl
import numpy as np
import sympy   # 引入解方程的专业模块sympy


def Distance(X, n ):#计算两两城市之间的距离
    D=np.zeros((n,n))
    for i in range(0,n):
        for j in range(i+1,n):
            D[i][j] = math.sqrt((X[i][0] - X[j][0])**2 + (X[i][1] - X[j][1])**2);
            D[j][i] = D[i][j];
    return D

def useful(Route, citys):#路线 城市坐标
    pl.mpl.rcParams['font.sans-serif'] = ['FangSong'] # 指定默认字体
    pl.mpl.rcParams['axes.unicode_minus'] = False # 解决保存图像是负号'-'显示为方块的问题
    x = range(10)  # 横轴的数据
    y = [i*i for i in x]  # 纵轴的数据
    y1 = [i*i+10 for i in x]  # 纵轴的数据
    y2=[i*i+20 for i in x] #纵坐标
    pl.title('title zyr')
    pl.plot(x, y, '1m:', label=u'compare')  # 加上label参数添加图例
    pl.plot(x, y1, '>r--', label=u'set other')  # 加上label参数添加图例
    #标记遍历的 顺序

    pl.plot(x,y2,'h',label=u'others')
    pl.xlabel(u"横轴的数据")
    pl.ylabel(u"纵轴的数据")
    pl.legend()  # 让图例生效
    pl.show()  # 显示绘制出的图
    return

def DrawPath(Route, citys,n):#将路径用图的形式呈现出来欸
    pl.rcParams['savefig.dpi'] =300 #图片像素
    pl.rcParams['figure.dpi'] = 300 #分辨率
    pl.mpl.rcParams['font.sans-serif'] = ['FangSong'] # 指定默认字体
    pl.mpl.rcParams['axes.unicode_minus'] = False # 解决保存图像是负号'-'显示为方块的问题
    pl.title('初始化路线')
    plt.xlim(xmax=25.5000,xmin=14.0000)#坐标上下界
    plt.ylim(ymax=98.5000,ymin=91.5000)
    x = [citys[Route[i%n]][0] for i in range(n+1)]  # 横轴的数据
    y = [citys[Route[i%n]][1] for i in range(n+1)]  # 纵轴的数据
    pl.plot(x, y, 'o--', label=u'初始化路线')  # 加上label参数添加图例
    #标记起点终点
    pl.plot(citys[Route[0]][0], citys[Route[0]][1],'or' ,label=u'起点');
    pl.plot(citys[Route[n-1]][0], citys[Route[n-1]][1],'og', label=u' 终点');
    for i in range(n):
        pl.text(citys[Route[i]][0],citys[Route[i]][1],i+1,color='k')#显示遍历顺序
    pl.xlabel(u"X轴")
    pl.ylabel(u"Y轴")
    pl.legend()  # 让图例生效
    #pl.axis('off')
    #pl.savefig('路径', dpi=300) #指定分辨
    pl.show()  # 显示绘制出的图
    return
def DrawPath2(Route, citys,n):#将路径用图的形式呈现出来欸
    pl.rcParams['savefig.dpi'] =300 #图片像素
    pl.rcParams['figure.dpi'] = 300 #分辨率
    pl.mpl.rcParams['font.sans-serif'] = ['FangSong'] # 指定默认字体
    pl.mpl.rcParams['axes.unicode_minus'] = False # 解决保存图像是负号'-'显示为方块的问题
    pl.title('优化后的路线')
    plt.xlim(xmax=25.5000,xmin=14.0000)#坐标上下界
    plt.ylim(ymax=98.5000,ymin=91.5000)
    x = [citys[Route[i%n]][0] for i in range(n+1)]  # 横轴的数据
    y = [citys[Route[i%n]][1] for i in range(n+1)]  # 纵轴的数据
    pl.plot(x, y, 'o--', label=u'优化后的路线')  # 加上label参数添加图例
    #标记起点终点
    pl.plot(citys[Route[0]][0], citys[Route[0]][1],'or' ,label=u'起点');
    pl.plot(citys[Route[n-1]][0], citys[Route[n-1]][1],'og', label=u' 终点');
    for i in range(n):
        pl.text(citys[Route[i]][0],citys[Route[i]][1],i+1,color='k')#显示遍历顺序
    pl.xlabel(u"X轴")
    pl.ylabel(u"Y轴")
    pl.legend()  # 让图例生效
    #pl.axis('off')
    #pl.savefig('路径', dpi=300) #指定分辨
    pl.show()  # 显示绘制出的图
    return

def PathLength(D, Route,n):#计算路径长度
    length=0.0
    for i in range(0,n):
        length+=D[Route[i]][Route[(i+1)%n]]
    return length
def NewAnswer(S1,n):#随机产生 新的解
    S2=S1.copy()
    random.seed();
    a=random.randint(0,n-1)
    random.seed();
    b=random.randint(0,n-1)
    w=S1[a]
    S2[a]=S1[b]
    S2[b]=w
    #print(a,b)
    return S2
def process(count,Height):
    pl.rcParams['savefig.dpi'] =300 #图片像素
    pl.rcParams['figure.dpi'] = 300 #分辨率
    pl.mpl.rcParams['font.sans-serif'] = ['FangSong'] # 指定默认字体
    pl.mpl.rcParams['axes.unicode_minus'] = False # 解决保存图像是负号'-'显示为方块的问题
    pl.title('优化过程')
    plt.xlim(xmax=900,xmin=0)#坐标上下界
    plt.ylim(ymax=80,ymin=0)
    x = range(1,count+1)  # 横轴的数据
    y = [Height[i] for i in range(1,count+1)]  # 纵轴的数据
    pl.plot(x, y, ':k', label=u'实现优化的过程')  # 加上label参数添加图例
    #标记起点终点
    pl.xlabel(u"次数")
    pl.ylabel(u"距离")
    pl.legend()  # 让图例生效
    #pl.axis('off')
    #pl.savefig('路径', dpi=300) #指定分辨
    pl.show()  # 显示绘制出的图
    return
def Metropolis(S1, S2, D, T,n):
# 输入
# S1:  当前解
# S2:   新解
# D:    距离矩阵(两两城市的之间的距离)
# T:    当前温度
# 输出
# S:   下一个当前解
# R:   下一个当前解的路线距离

    R1 = PathLength(D,S1,n);         #计算S1路线长度
    R2 = PathLength(D,S2,n);         # 计算S2路线长度
    dC = R2 - R1;                  # 计算能力之差
    #print(S1,S2)
    #print(R2,R1,dC)
    if (dC < 0.0): #如果能力降低 接受新路线
        S = S2;                    #接受新解
        R = R2;
    elif(math.exp(float(-dC)/float(T))>= (random.random())):       #以exp(-dC/T)概率接受新路线 这的rand 返回(0,1)之间的随机数
        S = S2;
        R = R2;
        #print(float(-dC)/float(T))
    else:                           # 不接受新路线
        S = S1;
        R = R1;

    return S,R;


X =np.array([ [16.4700 ,  96.1000],
    [ 16.4700 ,  94.4400],
     [20.0900 ,  92.5400],
     [22.3900 ,  93.3700],
     [25.2300  , 97.2400],
     [22.0000 ,  96.0500],
     [20.4700  , 97.0200],
     [17.2000 , 96.2900],
    [16.3000 ,  97.3800],
     [14.0500  , 98.1200],
     [16.5300 ,  97.3800],
     [21.5200  , 95.5900],
     [19.4100  , 97.1300],
     [20.0900  , 92.5500]]);#每个城市点的x,y坐标
n=(X.shape[0])#这个矩阵有几行 啊
#print(n)
D=Distance(X,n)#算出距离矩阵
#print(D)
T0 = 1e10;  #初始温度
Tf = 1e-30;         #终止温度
#print(T0,Tf)
q=0.90
# 计算迭代的次数 T0 * (0.9)^x = Tf
Time =1000
#print(Time)
count = 0; # 初始化迭代计数
Obj = np.zeros((Time, 1));  # 目标值矩阵初始化
path = np.zeros((Time, n),dtype=int);  # 每代的最优路线矩阵初始化
#随机初始化一个路线
S1=np.random.permutation(n);
#print(S1)
DrawPath(S1, X,n)  ;#随机生成一个初始路径
print("初始种群中的一个随机值:")
for i in range(n):
    print(S1[i]+1,"->",end="")
print(S1[0]+1)
print("距离=",end="")
rlength = PathLength(D, S1,n);
print(rlength)

while T0>=Tf:
    count =count +1#更新迭代次数
    S2=NewAnswer(S1,n)#随机产生一个新的解
    S1,R= Metropolis(S1, S2, D,T0,n)
    if ((count == 1) or( R < Obj[count-1])): #选
        Obj[count] = R
    else:#不选
        Obj[count] = Obj[count-1]
    path[count] = S1   # 记录每次迭代的路线

    T0=T0*1.0*q       #以q的速率降温

#改进的过程
process(count,Obj)
#最优解

DrawPath2(path[count],X,n)
print("最优解")
for i in range(n):
    print(path[count][i]+1,"->",end="")
print(path[count][0]+1)
print("距离=",end="")
print(Obj[count])