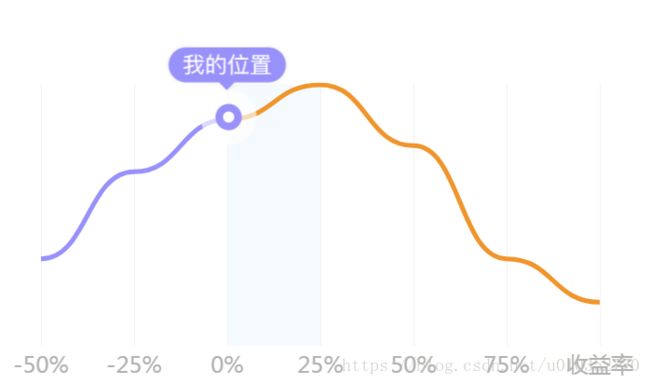
echarts 双色折线图
echarts虽然提供了很多样例,但是常常还是会遇到稍微特殊的需求,比如上图的双色折线图。
核心思路:画两个折线图data分别为 data: [10, 20, 26, "-", "-", "-", "-"],data: ["-", "-", 26, 30, 23, 10, 5],没有数值的点,自然就没有折线,最后拼出来一条两边双色的折线图了。
完整option如下:
	let contrast_chartOption = {
	    tooltip: {
	        show: false,
	        trigger: 'axis'
	    },
	    xAxis: {
	        type: 'category',
	        boundaryGap: false,
	        data: ['-50%', '-25%', '0%', '25%', '50%', '75%', '收益率'],
	        axisLine: {
	            show: false,
	            lineStyle: {
	                color: "#999"
	            }
	        },
	        axisTick: {
	            show: false
	        },
	        axisLabel: {
	            interval:0,
	            show: true,
	            textStyle: {
	                fontSize: 24,
	                color: "#b2b2b2",
	                align: "center"
	            }
	        },
	        splitLine: {
	            show: true,
	            lineStyle: {
	            	width: 1,
	            	color: "#f1f1f1"
	            }
	        }
	    },
	    yAxis: {
	        type: 'value',
	        axisLine: {
	            show: false
	        },
	        axisTick: {
	            show: false
	        },
	        axisLabel: {
	            show: false,
	            textStyle: {
	                color: "#fff",
	                align: "left"
	            }
	        },
	        splitLine: {
	            show: false
	        }
	    },
	    series: [
	        {
	            name: '收益率',
	            type: 'line',
	            smooth:true,
	            symbol: 'none',
	            lineStyle:{
	            	normal: {
	            		width: 5,
	            		color: '#9991fa'
	            	}
	            },
	            itemStyle:{
	                normal: {
	                    color:'#3C89ED' ,
	                    lineStyle:'#3C89ED'
	                }
	            },
	            data: [10, 20, 26, "-", "-", "-", "-"],
	            markPoint : {
	                symbol: 'image://../img/my-position.png',
	                symbolSize:135,
	                symbolOffset:[0, '-20%'],
	                showDelay:0,
	                itemStyle:{
	                    normal:{
	                        label:{
	                            show: false
	                        }
	                    }

	                },
	                data : [
	                    {name : '最高', value :26, xAxis: 2, yAxis: 26}//通过yAxis来控制markPoint的位置
	                ]
	            },
				markArea: {
					itemStyle :{
						normal :{
							color : '#eef6fe',
							borderColor: 'red',
							borderWidth: 0,
							opacity: 0.6
						},
						emphasis :{
							color : '#eef6fe'
						}
					},
					data: [
						[{
							xAxis: '2'
						}, {
							xAxis: '3'
						}]
					]
				}
	        },{
	            name: '收益率',
	            type: 'line',
	            smooth:true,
	            symbol: 'none',
	            lineStyle:{
	            	normal: {
	            		width: 5 ,
	            		color: '#f0952b'
	            	}
	            },
	            itemStyle:{
	                normal: {
	                    color:'#EB1F10' ,
	                    lineStyle:'#EB1F10'

	                }
	            },
	            data: ["-", "-", 26, 30, 23, 10, 5]
	        }
	    ]
	};
echarts虽然提供了很多样例,但是常常还是会遇到稍微特殊的需求,比如上图的双色折线图。
