pyecharts基础图表汇总(三国演义可视化)
Draw.py 算是我造的第一个轮子吧,绝大多数可以用,但是如果有问题就改源码,源码在这里呢是吧。
from pyecharts import options as opts
from pyecharts.charts import Bar
from pyecharts.charts import Pie
from pyecharts.charts import Line
from pyecharts.charts import Graph
from pyecharts.charts import WordCloud
from pyecharts.commons.utils import JsCode
from pyecharts.charts import Radar
from pyecharts.charts import PictorialBar
def rinse(lista):
    arrt = []
    value = []
    for i in range(20):
        arrt.append(lista[i][0])
        value.append(lista[i][1])
    return arrt,value
# 饼图
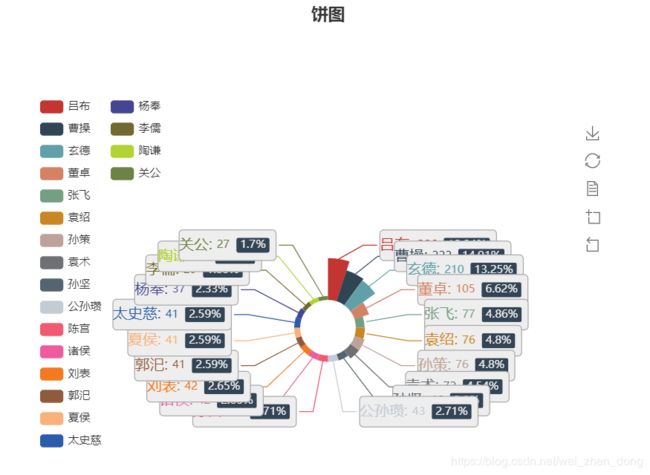
def drawpie(attr,value,name):
    list1 = [list(z) for z in zip(attr,value)]
    # 图表初始化配置
    init_opts = opts.InitOpts(page_title=name)

    pie = Pie(init_opts=init_opts)
    # 标题配置
    title = opts.TitleOpts(title=name,
                           pos_left='center')
    # 图例配置
    legend_opts = opts.LegendOpts(orient="vertical",
                                  pos_top="20%",
                                  pos_left="15%")

    # 工具箱配置
    # feature = opts.ToolBoxFeatureOpts(save_as_image=True, restore=True, data_view=True, data_zoom=True)
    # 工具箱配置
    toolbox_opts = opts.ToolboxOpts(orient="vertical",
                                    pos_top="25%",
                                    pos_right="15%"
                                    )

    pie.set_global_opts(title_opts=title,
                        legend_opts=legend_opts,
                        toolbox_opts=toolbox_opts
                        )
    # 标签配置项
    pie.add("",
            list1,
            radius=[30, 75],
            center=['50%', '70%'],
            rosetype="area",
            label_opts=opts.LabelOpts(
                position="outside",
                formatter="{b|{b}: }{c}  {per|{d}%}  ",
                background_color="#eee",
                border_color="#aaa",
                border_width=1,
                border_radius=4,
                rich={
                    "a": {"color": "#999", "lineHeight": 22, "align": "center"},
                    "abg": {
                        "backgroundColor": "#e3e3e3",
                        "width": "100%",
                        "align": "right",
                        "height": 22,
                        "borderRadius": [4, 4, 0, 0],
                    },
                    "hr": {
                        "borderColor": "#aaa",
                        "width": "100%",
                        "borderWidth": 0.5,
                        "height": 0,
                    },
                    "b": {"fontSize": 16, "lineHeight": 33},
                    "per": {
                        "color": "#eee",
                        "backgroundColor": "#334455",
                        "padding": [2, 4],
                        "borderRadius": 2,
                    },
                },
            ),

     )

    pie.render('{0}.html'.format(name))
# 趋势图
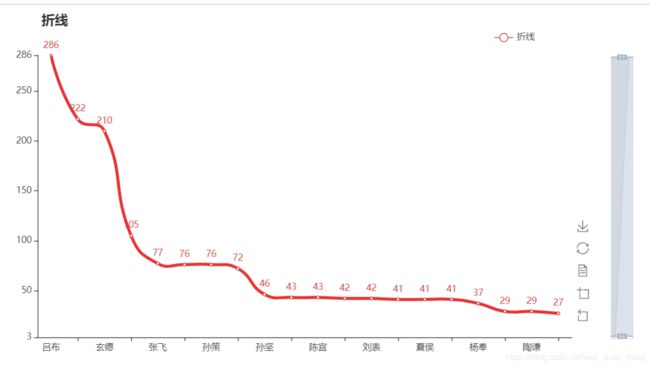
def drawline(arrt,value,name):

    # 图表初始化配置
    init_opts = opts.InitOpts(page_title=name)

    line = Line(init_opts=init_opts)
    # 标题配置
    title = opts.TitleOpts(title=name,
                           pos_left="10%")
    # 图例配置
    legend_opts = opts.LegendOpts(orient="horizontal",
                                  pos_top="5%",
                                  pos_right="15%")

    # 工具箱配置
    # feature = opts.ToolBoxFeatureOpts(save_as_image=True, restore=True, data_view=True, data_zoom=True)
    # 工具箱配置
    toolbox_opts = opts.ToolboxOpts(orient="vertical",
                                    pos_bottom="15%",
                                    pos_left="90%",
                                    )

    line.set_global_opts(title_opts=title,
                         legend_opts=legend_opts,
                         toolbox_opts=toolbox_opts,
                         datazoom_opts = opts.DataZoomOpts(orient="vertical"),
                         )
    line.add_xaxis(arrt, )
    line.add_yaxis(name, value, is_smooth=True, linestyle_opts=opts.LineStyleOpts(color="#E83132", width="4"))
    line.render('{0}.html'.format(name))
# 词云图
def drawWordCloud(words,name):
    # 图表初始化配置
    init_opts = opts.InitOpts(page_title=name)

    wc = WordCloud(init_opts=init_opts)
    # 标题配置
    title = opts.TitleOpts(title=name,
                           pos_left="50%")
    toolbox_opts = opts.ToolboxOpts(orient="vertical",
                                    pos_bottom="40%",
                                    pos_left="90%",
                                    )

    wc.set_global_opts(title_opts=title,
                       toolbox_opts=toolbox_opts,
                       )
    wc.add("",
           words,
           word_size_range=[20, 1000],
           shape="diamond",
           textstyle_opts=opts.TextStyleOpts(font_family="cursive"),
           )
    wc.render("{0}.html".format(name))
# 柱状图
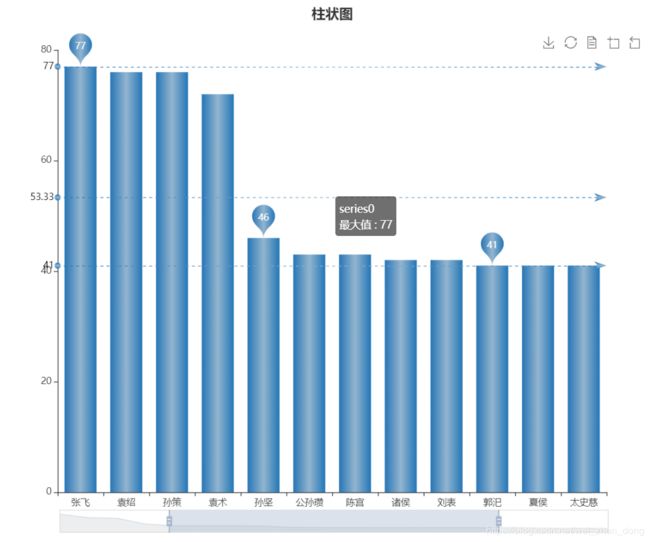
def drawbar(arrt,value,name):
    # 图表初始化配置
    init_opts = opts.InitOpts(page_title = name,
                              height="700px")
    bar = Bar(init_opts=init_opts)
    # 标题配置
    title = opts.TitleOpts(title=name,
                           pos_left='center')
    # 图例配置
    legend_opts = opts.LegendOpts(
                                  pos_top="5%",
                                  pos_left="15%")
    # 工具箱配置
    # feature = opts.ToolBoxFeatureOpts(save_as_image=True, restore=True, data_view=True, data_zoom=True)
    # 工具箱配置
    toolbox_opts = opts.ToolboxOpts(
                                    pos_top="5%",
                                    pos_right="30%"
                                    )
    bar.set_global_opts(title_opts=title,
                        legend_opts=legend_opts,
                        toolbox_opts=toolbox_opts,
                        # 区域缩放配置项
                        datazoom_opts=opts.DataZoomOpts(),
                        )

    # add_yaxis

    bar.add_xaxis(arrt)
    # 渐变色
    bar.add_yaxis("",
                  value,
                  gap="0%",
                  category_gap="30%",
                  # 自定义颜色
                  itemstyle_opts=opts.ItemStyleOpts(color=JsCode(
                      """new echarts.graphic.LinearGradient(0, 0, 1, 0,
                                              [{
                                                  offset: 0,
                                                  color: 'rgb(39, 117, 182)'
                                              },
                                              {
                                                  offset: 0.5,
                                                  color: 'rgb(147, 181,207)'
                                              },
                                              {
                                                  offset: 1,
                                                  color: 'rgb(35, 118, 183)'
                                              }], false)"""
                  )),
                  )
    bar.set_series_opts(
        label_opts=opts.LabelOpts(is_show=False),
        markline_opts=opts.MarkLineOpts(
            data=[
                opts.MarkLineItem(type_="min", name="最小值"),
                opts.MarkLineItem(type_="max", name="最大值"),
                opts.MarkLineItem(type_="average", name="平均值"),
            ]
        ),

        markpoint_opts=opts.MarkPointOpts(
            data=[
                opts.MarkPointItem(type_="max", name="最大值"),
                opts.MarkPointItem(type_="min", name="最小值"),
                opts.MarkPointItem(type_="average", name="平均值"),
            ]
        ),
    )
    bar.render('{0}.html'.format(name))
# 地图
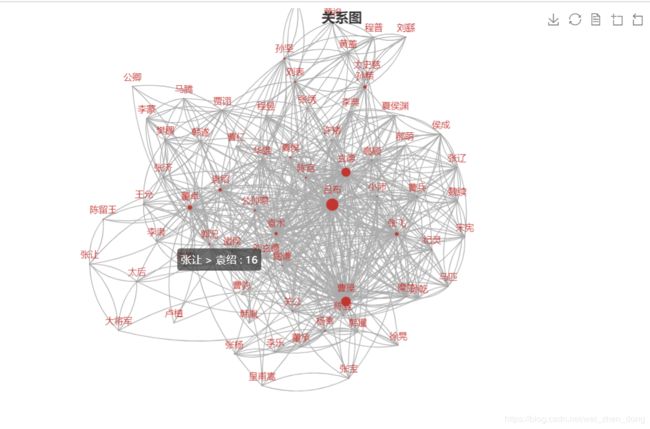
def drawGraph(nodes,links,name):
    # 图表初始化配置
    init_opts = opts.InitOpts(page_title=name,
                              height="700px")
    g = Graph(init_opts=init_opts)
    # 标题配置
    title = opts.TitleOpts(title=name,
                           pos_left='center')
    # 图例配置
    legend_opts = opts.LegendOpts(
                                    pos_top="5%",
                                    pos_left="15%"
                                    )
    # 工具箱配置
    # 工具箱配置
    toolbox_opts = opts.ToolboxOpts()
    g.set_global_opts(title_opts=title,
                      legend_opts=legend_opts,
                      toolbox_opts=toolbox_opts,
                      )

    g.add("", nodes, links, repulsion=8000,linestyle_opts=opts.LineStyleOpts(curve=0.2),)
    g.render("{0}.html".format(name))
# 雷达图
def drawRadar(arr, value, valuemax, name):
    radar = Radar(init_opts=opts.InitOpts(width="1280px", height="720px", bg_color="#CCCCCC"))
    v_max = [list(z) for z in zip(arr, valuemax)]
    radar.add_schema(
        schema=[
            opts.RadarIndicatorItem(name=k, max_=v) for k, v in v_max
        ],
        splitarea_opt=opts.SplitAreaOpts(
            is_show=True, areastyle_opts=opts.AreaStyleOpts(opacity=1)
        ),
        textstyle_opts=opts.TextStyleOpts(color="#fff"),
    )
    radar.add(
        series_name=name,
        data=value,
        linestyle_opts=opts.LineStyleOpts(color="#CD0000"),
    )
    radar.set_series_opts(label_opts=opts.LabelOpts(is_show=False))
    radar.set_global_opts(
        title_opts=opts.TitleOpts(title=name), legend_opts=opts.LegendOpts()
    )
    radar.render("{0}.html".format(name))
# arr = ["销售(sales)", "管理(Administration)", "信息技术(Information Technology)", "客服(Customer Support)",
#        "研发(Development)",
#        "市场(Marketing)"]
# value = [[4300, 10000, 28000, 35000, 50000, 19000]]
# valuemax = [6500, 16000, 30000, 38000, 52000, 25000]
# draw(arr, value, valuemax, "data/清华大学")
# 象形图
def drawPictorialBar(location,values,name):
    c = (
        PictorialBar()
        .add_xaxis(location)
        .add_yaxis(
            "",
            values,
            label_opts=opts.LabelOpts(is_show=False),
            symbol_size=22,
            symbol_repeat="fixed",
            symbol_offset=[0, -5],
            is_symbol_clip=True,
            # symbol='image://https://github.githubassets.com/images/spinners/octocat-spinner-32.gif'
            symbol='image://http://weizhendong.top/images/1.png'
        )
        .reversal_axis()
        .set_global_opts(
            title_opts=opts.TitleOpts(title="PictorialBar-自定义 Symbol"),
            xaxis_opts=opts.AxisOpts(is_show=False),
            yaxis_opts=opts.AxisOpts(
                axistick_opts=opts.AxisTickOpts(is_show=False),
                axisline_opts=opts.AxisLineOpts(
                    linestyle_opts=opts.LineStyleOpts(opacity=0)
                ),
            ),
        )
        .render("{0}.html".format(name))
    )
# location = ["山西", "四川", "西藏", "北京", "上海", "内蒙古", "云南", "黑龙江", "广东", "福建"]
# values = [13, 42, 67, 81, 86, 94, 166, 220, 249, 262]
# drawPictorialBar(location,values,"llalal")
应用:
from collections import Counter
import jieba.posseg as psg
import Draw as draw
import pyecharts.options as opts
def count(seg_list1):
    # 计数
    count = Counter(seg_list1)
    # 字典排序
    result = sorted(count.items(), key=lambda x: x[1], reverse=True)
    return result

def readjieba(text,excludes,list_replace):
    dic_result = {}
    seg_list1 = []
    nr=[]
    ns=[]
    # 分词
    seg_list = psg.cut(text)
    for w, t in seg_list:
        # 去除停用词
        if len(w) != 1 and t != 'm' and w not in excludes:
            # 替换词
            for j in list_replace:
                if w == j[0]:
                    real_word == j[1]
                else:
                    real_word = w
            if t == 'nr':
                nr.append("{0}".format(real_word))
            if t=='ns':
                ns.append("{0}".format(real_word))
            seg_list1.append("{0}".format(real_word))

    dic_result.setdefault("全部", count(seg_list1))
    dic_result.setdefault("人名", count(nr))
    dic_result.setdefault("地名", count(ns))
    return dic_result

def names_relationships(text_list,excludes,list_replace):
    names = {}#  保存人物,键为人物名称,值为该人物在全文中出现的次数
    relationships = {}#保存人物关系的有向边,键为有向边的起点,值为一个字典 edge ,edge 的键为有向边的终点,值是有向边的权值
    lineNames = []# 缓存变量,保存对每一段分词得到当前段中出现的人物名称
    for line in text_list:
        poss = psg.cut(line)  # 分词,返回词性
        lineNames.append([])  # 为本段增加一个人物列表
        for w in poss:
            if w.flag != 'nr' or len(w.word) < 2 or w.word in excludes:
                continue  # 当分词长度小于2或该词词性不为nr(人名)时认为该词不为人名
            else:
                for j in list_replace:
                    if w.word == j[0]:
                        real_word == j[1]
                    else:
                        real_word = w.word
            lineNames[-1].append(real_word)  # 为当前段的环境增加一个人物

            if names.get(real_word) is None:  # 如果某人物(w.word)不在人物字典中
                names[real_word] = 0
                relationships[real_word] = {}
            names[real_word] += 1

                # 输出人物出现次数统计结果
    # for name, times in names.items():
    #    print(name, times)

    # 对于 lineNames 中每一行,我们为该行中出现的所有人物两两相连。如果两个人物之间尚未有边建立,则将新建的边权值设为 1,
    # 否则将已存在的边的权值加 1。这种方法将产生很多的冗余边,这些冗余边将在最后处理。
    for line in lineNames:
        for name1 in line:
            for name2 in line:
                if name1 == name2:
                    continue
                if relationships[name1].get(name2) is None:
                    relationships[name1][name2] = 1
                else:
                    relationships[name1][name2] = relationships[name1][name2] + 1
    return names,relationships

                # 由于分词的不准确会出现很多不是人名的“人名”,从而导致出现很多冗余边,
                # 为此可设置阈值为10,即当边出现10次以上则认为不是冗余
# 处理节点和边
def node_links(names,relationships):
    nodes = []
    links = []
    for name, times in names.items():
        if times > 10:
            nodes.append(opts.GraphNode(name=str(name), symbol_size=times/10,))
    for name, edges in relationships.items():
        for v, w in edges.items():
            if w > 10:
                links.append(opts.GraphLink(source=str(name), target=str(v), value=str(w)))
    return nodes,links

def rinse(lista):
    arrt = []
    value = []
    for i in range(20):
        arrt.append(lista[i][0])
        value.append(lista[i][1])
    return arrt,value


if __name__ == '__main__':
    excludes = {'将军', '却说', '令人', '赶来', '徐州', '不见', '下马', '喊声', '因此', '未知', '大败', '百姓', '大事', '一军', '之后', '接应', '起兵',
                '成都', '原来', '江东', '正是', '忽然', '原来', '大叫', '上马', '天子', '一面', '太守', '不如', '忽报', '后人', '背后', '先主', '此人',
                '城中', '然后', '大军', '何不', '先生', '何故', '夫人', '不如', '先锋', '二人', '不可', '如何', '荆州', '不能', '如此', '主公', '军士',
                '商议', '引兵', '次日', '大喜', '魏兵', '军马', '于是', '东吴', '今日', '左右', '天下', '不敢', '陛下', '人马', '不知', '都督', '汉中',
                '一人', '众将', '后主', '只见', '蜀兵', '马军', '黄巾', '立功', '白发', '大吉', '红旗', '士卒', '钱粮', '于汉', '郎舅', '龙凤', '古之',
                '白虎', '古人云', '尔乃', '马飞报', '轩昂', '史官', '侍臣', '列阵', '玉玺', '车驾', '老夫', '伏兵', '都尉', '侍中', '西凉', '安民', '张曰', '文武',
                '白旗',
                '祖宗', '寻思'}  # 排除的词汇
    key = "玄德曰"
    value = "刘备"
    list_replace = []
    list_replace.append(tuple((key, value)))
    print(list_replace)

    with open('三国.txt', 'r', encoding='utf-8') as f:
        text =f.read()
    result = readjieba(text,excludes,list_replace)


    """词云"""
    draw.drawWordCloud(result["全部"],"词云")

    lista = result["人名"]
    """柱状图,饼图,折线"""
    arrt, value = rinse(lista)
    draw.drawpie(arrt,value,"饼图")
    draw.drawbar(arrt,value,"柱状图")
    draw.drawline(arrt,value,"折线")

    """关系图"""
    text_list =text.splitlines()
    names, relationships = names_relationships(text_list, excludes, list_replace)
    nodes, links = node_links(names, relationships)
    draw.drawGraph(nodes, links, "关系图")
