在matplotlib中,整个图像为一个Figure对象
在Figure对象中可以包含一个或者多个Axes对象
每个Axes(ax)对象都是一个拥有自己坐标系统的绘图区域
plt.figure, plt.subplot
# plt.figure() 绘图对象
# plt.figure(num=None, figsize=None, dpi=None, facecolor=None, edgecolor=None,
# frameon=True, FigureClass=, **kwargs)
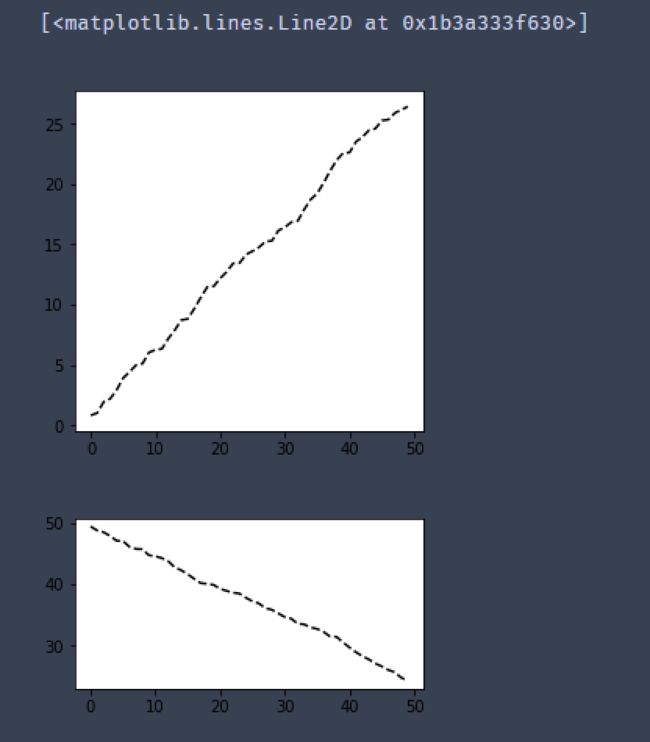
fig1 = plt.figure(num=1,figsize=(4,4))
plt.plot(np.random.rand(50).cumsum(),'k--')
fig2 = plt.figure(num=2,figsize=(4,2))
plt.plot(50-np.random.rand(50).cumsum(),'k--')
# num:图表序号,可以试试不写或都为同一个数字的情况,图表如何显示
# figsize:图表大小
# 当我们调用plot时,如果设置plt.figure(),则会自动调用figure()生成一个figure, 严格的讲,是生成subplots(111)
图片.png
# 子图创建1 - 先建立子图然后填充图表

fig = plt.figure(figsize=(10,6),facecolor = 'gray')

ax1 = fig.add_subplot(2,2,1)  # 第一行的左图
plt.plot(np.random.rand(50).cumsum(),'k--')
plt.plot(np.random.randn(50).cumsum(),'b--')
# 先创建图表figure,然后生成子图,(2,2,1)代表创建2*2的矩阵表格,然后选择第一个,顺序是从左到右从上到下
# 创建子图后绘制图表,会绘制到最后一个子图

ax2 = fig.add_subplot(2,2,2)  # 第一行的右图
ax2.hist(np.random.rand(50),alpha=0.5,edgecolor='black')

ax4 = fig.add_subplot(2,2,3)  # 第二行的右图
df2 = pd.DataFrame(np.random.rand(10, 4), columns=['a', 'b', 'c', 'd'])
ax4.plot(df2,alpha=0.5,linestyle='--',marker='.')
# 也可以直接在子图后用图表创建函数直接生成图表

图片.png
# 子图创建2 - 创建一个新的figure,并返回一个subplot对象的numpy数组 → plt.subplot

fig,axes = plt.subplots(2,3,figsize=(10,6),facecolor = 'gray')
ts = pd.Series(np.random.randn(1000).cumsum())
print(axes, axes.shape, type(axes))
# 生成图表对象的数组
# print(ts)
ax1 = axes[1,2]
ax1.plot(ts)

图片.png
# plt.subplots,参数调整

fig,axes = plt.subplots(2,2,sharex=True,sharey=True,figsize=(13,6))
# sharex,sharey:是否共享x,y刻度

for i in range(2):
    for j in range(2):
        axes[i,j].hist(np.random.randn(500),color='r',alpha=0.5,edgecolor='b')
plt.subplots_adjust(wspace=0,hspace=0)
# wspace,hspace:用于控制宽度和高度的百分比,比如subplot之间的间距

图片.png
# 子图创建3 - 多系列图,分别绘制

df = pd.DataFrame(np.random.randn(1000, 4), index=ts.index, columns=list('ABCD'))
df = df.cumsum()
df.plot(style = '--.',alpha = 0.4,grid = True,figsize = (14,10),
       subplots = True,
       layout = (2,3),
       sharex = False)
plt.subplots_adjust(wspace=0,hspace=0.2)
# plt.plot()基本图表绘制函数 → subplots,是否分别绘制系列(子图)
# layout:绘制子图矩阵,按顺序填充

图片.png