pheatmap包更改参数绘制热图_2020-02-16
## 1.设置当前工作目录
setwd("./pheatmap/")## 2.导入R包
library(pheatmap)## 3.更改参数,绘制不一样的热图
### 3.1 构建测试数据
test = matrix(rnorm(200), 20, 10)
test[1:10, seq(1, 10, 2)] = test[1:10, seq(1, 10, 2)] + 3
test[11:20, seq(2, 10, 2)] = test[11:20, seq(2, 10, 2)] + 2
test[15:20, seq(2, 10, 2)] = test[15:20, seq(2, 10, 2)] + 4
colnames(test) = paste("Sample", 1:10, sep = "")
rownames(test) = paste("Gene", 1:20, sep = "")
#@ 查看数据内容
head(test)
#         Sample1    Sample2  Sample3    Sample4  Sample5    Sample6  Sample7    Sample8  Sample9    Sample10
# Gene1 0.1084687  1.1219415 3.284323  0.9017767 3.036099  1.0657139 2.548128 -1.8322137 2.165044  1.77505618
# Gene2 3.2039837 -1.3553366 1.331803 -0.1979253 3.836506 -0.8022561 4.125474  0.9289945 4.057077  0.37484029
# Gene3 5.8578495  0.9871908 1.548738  0.4654781 2.088101 -0.4476888 2.414902 -1.2763380 3.198152  0.02951041
# Gene4 3.7080764  0.1894047 2.283227 -0.2560296 3.771637  0.1366358 2.743988 -0.8315322 2.613343  0.50344678
# Gene5 3.9848722 -0.3618820 4.289030 -0.2900232 2.926524  1.1507446 3.646968  1.4330913 2.732359 -0.48767404
# Gene6 1.9127712  0.5098176 3.039662 -0.3106462 2.956869 -0.1127505 3.145674  0.1498700 2.655560  1.27998185
### 3.2 默认参数绘制热图
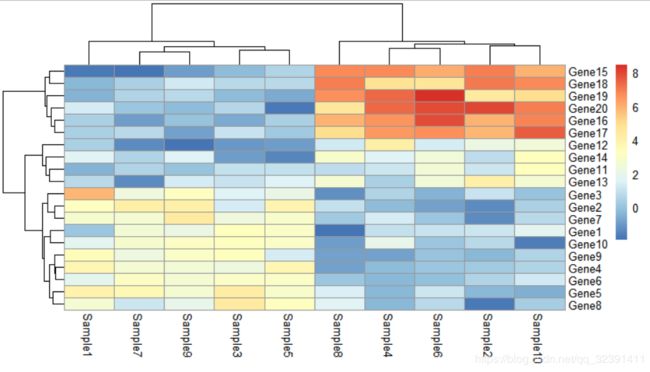
pheatmap(test)### 3.3 行聚类参数:cluster_row
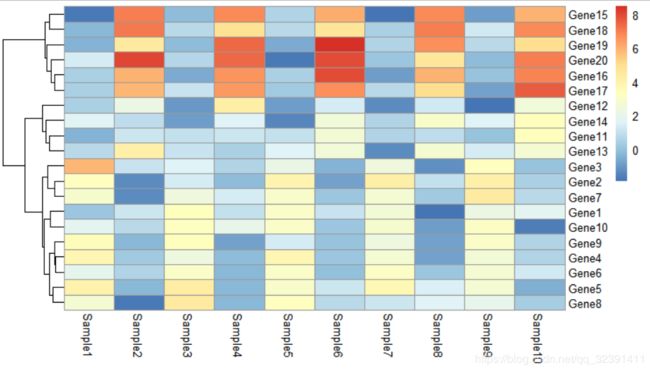
pheatmap(test, cluster_row = FALSE) # 参数cluster_row = FALSE不进行行聚类,cluster_row = TRUE进行行聚类,默认是进行行聚类的### 3.4 列聚类参数:cluster_cols
pheatmap(test, cluster_cols = FALSE) # 参数cluster_cols = FALSE不进行列聚类,cluster_cols = TRUE进行列聚类,默认进行列聚类### 3.5 图例参数:legend
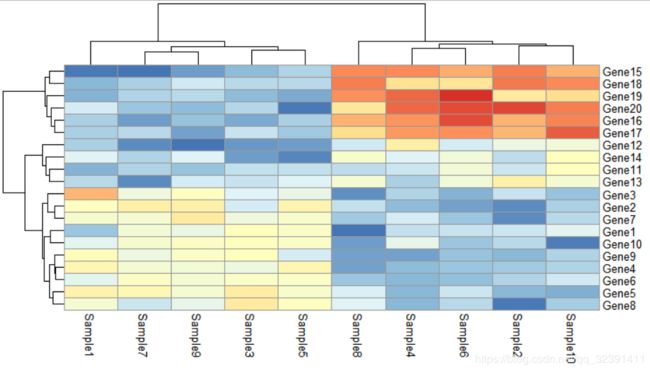
pheatmap(test, legend = FALSE) # 参数legend = FALSE不显示图例,legend = TRUE显示图例,默认显示图例### 3.6 热图单元格显示参数:display_numbers
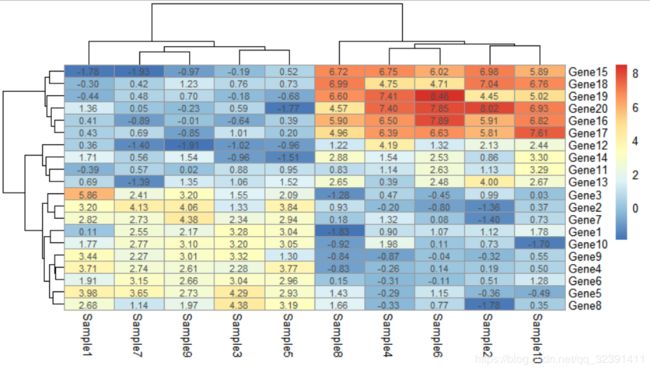
pheatmap(test, display_numbers = TRUE) # 参数display_numbers = TRUE显示单元格数值(热图颜色对应的表达值),display_numbers = FALSE不显示单元格数值,默认不显示### 3.7 单元格显示格式参数:number_format
pheatmap(test, display_numbers = TRUE, number_format = "%.1e") # 参数number_format = "%.1e"设置数值展示的格式,科学计数法显示数值### 3.8 单元格个性化显示设置(通过一些条件限制)
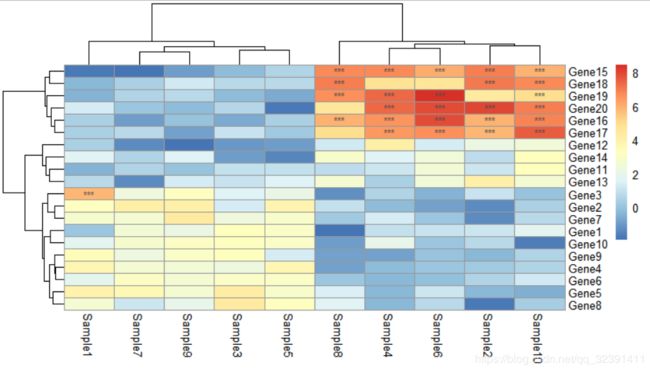
pheatmap(test, display_numbers = matrix(ifelse(test > 5, "***", ""), nrow(test))) # 参数display_numbers = matrix(ifelse(test > 5, "***", "")根据条件显示单元格标记,可以用一些特殊字符,例如:*### 3.9 热图图例个性化设置参数:legend_breaks和legend_labels
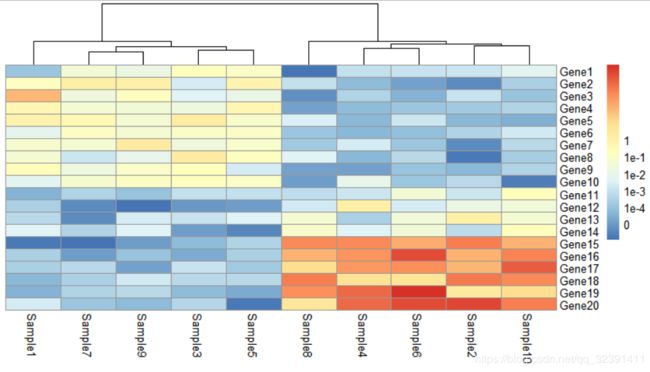
pheatmap(test, cluster_row = FALSE, legend_breaks = -1:4, legend_labels = c("0", "1e-4", "1e-3", "1e-2", "1e-1", "1")) # 参数legend_breaks = -1:4设置图例分段数,legend_labels则设置图例标记内容和格式
## 4.结束
sessionInfo()
# R version 3.6.2 (2019-12-12)
# Platform: x86_64-w64-mingw32/x64 (64-bit)
# Running under: Windows 10 x64 (build 18363)
#
# Matrix products: default
#
# locale:
# [1] LC_COLLATE=Chinese (Simplified)_China.936
# [2] LC_CTYPE=Chinese (Simplified)_China.936
# [3] LC_MONETARY=Chinese (Simplified)_China.936
# [4] LC_NUMERIC=C
# [5] LC_TIME=Chinese (Simplified)_China.936
#
# attached base packages:
# [1] stats     graphics
# [3] grDevices utils
# [5] datasets  methods
# [7] base
#
# other attached packages:
# [1] pheatmap_1.0.12
#
# loaded via a namespace (and not attached):
# [1] colorspace_1.4-1
# [2] scales_1.1.0
# [3] compiler_3.6.2
# [4] R6_2.4.1
# [5] tools_3.6.2
# [6] gtable_0.3.0
# [7] RColorBrewer_1.1-2
# [8] grid_3.6.2
# [9] lifecycle_0.1.0
# [10] packrat_0.5.0
# [11] munsell_0.5.0
# [12] rlang_0.4.4
