【实战】TF-IDF,WORD2VEC,机器学习算法,深度学习算法在新浪新闻分类表现。
新闻分类系统的实现
1 系统开发工具和平台
本文选择Python作为主要开发语言,作为一个简洁而又强大的脚步语言,Python整合了大量的第三方数据分析,算法处理框架,为开发带来极大的便利。
系统完整开发工具如图所示:
图1 分类系统开发工具汇总
在数据库方面,选择Mongodb来存储爬取到的新闻信息。Mongodb作为一个非关系型数据库,只需将爬取到的新闻信息转化为键值对的类型便能完成存储。在服务器构建上使用sqlite3作为存储数据库,用于展示网页上的新闻排序信息,sqlite3是python原生自带的数据库,使用sqlite3不用配置数据库环境,只用将服务器框架与其链接,便能在本地配置一个简易的数据库。
在对新闻文本数据预处理上,使用python的Pandas读取Mongodb数据库中存储信息,Pandas独特的DataFrame数据结构,会调用Numpy和Scipy封装的数据处理方法,将对数据表的处理转化成类似数学上线性代数的矩阵运算,只用告知程序行列属性,便能直接运算。相较C与Java对行列的复杂循环,Python的数据分析框架具有较高的代码可读性。但这会加大一定的运算时长作为代价。对处理好的数据,使用Matpoltlib来完成绘图。
与之同理,在处理中文分词,和拟合算法模型上,使用Python的第三方库jieba来作为分词工具,通过调用Scikit-learn封装的机器学习算法来完成分类器模块设计,而深度学习算法通过调用Keras封装的算法模型来完成(Keras的后端为TensorFlow)。在特征提取上Word2vec算法会通过调用Gensim来实现。
在最后的服务器实现上,使用Django搭建了一个新闻发布网站,前端使用Ajax请求来完成前后端交互,接收到新闻信息后,会通过Scikit-learn读取本地保存的分类器PKL文件,来完成算法匹配。
运行电脑配置如下:
·CPU:(英特尔)Intel(R) Core(TM) i7-7700 CPU @ 3.60GHz(3601 MHz)
·内存:8.00 GB ( 2400 MHz)
·显卡:Intel(R) HD Graphics 630 (1024 MB) (本项目使用的是cpu加速)
2 爬虫模块功能实现
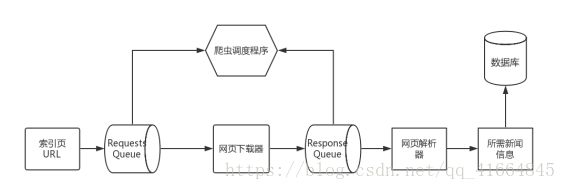
如图所示,实现爬虫模块主要以下5个步骤:
图1爬虫模块整体流程
Step1:使用python自带的urllib库,对新浪新闻发送http请求,得到API的内的数据,实则是一串json格式封装的新闻数据,包含新闻标题,新闻发布时间,新闻链接,新闻评论人数,新闻来源等信息。
Step2:使用python自带的json解析库,解析json数据,得到需要的新闻标题,发布时间,评论人数,新闻链接等信息。
Step3:异步加载通过访问之前解析出来的新闻链接,爬取相应的新闻内容。
Step4:将所有数据存入mongodb数据库中。为之后的机器学习建模提供数据集。
Step5:使用多进程库multiprocessing开启进程池,使用多线程库hreading开启多线程。循环翻页抓取全部所需信息。
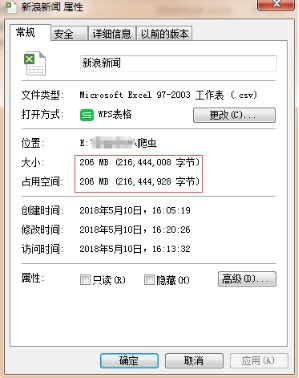
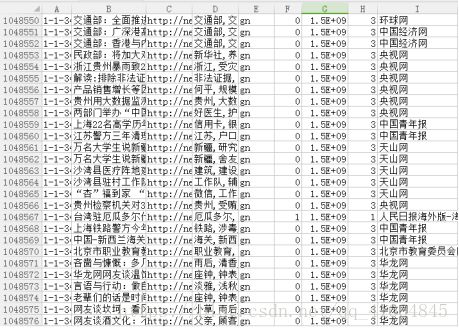
由于API爬虫的高效性,爬虫程序直接访问网页端存储的新闻信息Json数据,再配合多线程与多进程技术,爬虫模块半小时可以实现上百万的新闻数据爬取。将爬取信息从数据库导出结果如图2所示:
图2爬虫导出结果
预处理模块功能实现
通过pandas将数据库的新闻信息读入内存,数据格式为dataframe,做数据预处理工作。爬来的新闻数据中,部分新闻内容信息是缺失的,我们将其从102万条新闻数据中去除。最后可以使用的有48万条新闻数据。
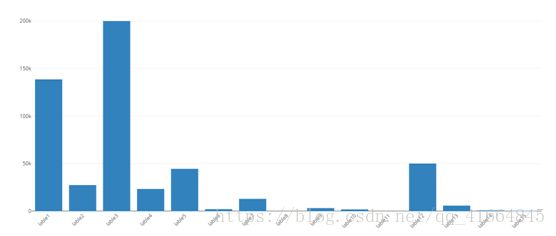
对这48万条数据进行分组,总共分为15个类的新闻数据。对不同新闻类别的统计如表所示:
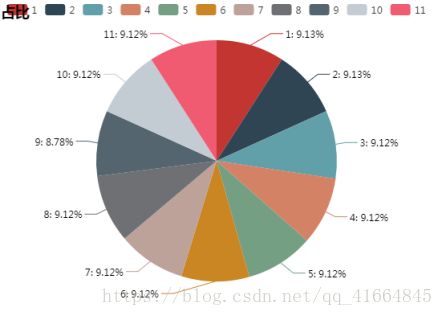
可以发现lable 14 和lable 15的只具有几百条,lable8和lable 11一个也没有,数据分布也十分不均匀。综合考虑下,最后选择剩下的11个lable,每个lable随机抽取两千条新闻信息。
每个类别分别代表:
| 汽车 |
财经 |
IT |
健康 |
体育 |
旅游 |
教育 |
军事 |
文化 |
娱乐 |
时尚 |
| 1 |
2 |
3 |
4 |
5 |
6 |
7 |
8 |
9 |
10 |
11 |
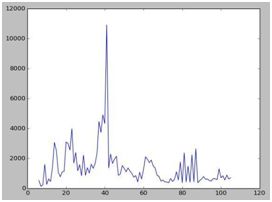
数据清洗好后,对每条新闻内容的长度进行统计发现新闻句子的长度基本在0至100内分布。于是我们选择100作为原始的新闻数据截取长度。
舍去长度高于100的那部分内容,只用前100字作为训练样本,让数据分别更均匀,同时也减少了特征的维度。接下来,我们使用jieba分词工具来处理这些新闻信息。
在使用jieba前,使用正则表达式将原文本信息转换为只有中文组成的句子,去除标点符号或者分割符对词频统计的影响。
Jieba分词后效果如下:
| Lable |
分词示例 |
| 6 |
幸福 时刻 全家福 旅游 照片 年 月 日 陕西省 翠 花山 全家福 旅游 照片 年 月 日 ..... |
| 1 |
佛山市 佛 陈 大桥 下 周三 起 实施 全封闭 维修 广佛 都市网 讯 佛山 日报 已经 ...... |
| 5 |
图文 长沙 站 预选赛 颁奖仪式 鲨鱼 球杆 梁宝忠 月 日 英伦 汽车 乔氏 杯 决战 亨德利 ...... |
| 11 |
银曼 专注 生活 细节 探寻 美丽 真谛 爱美 的 你 是否 曾 希望 每天 都 与 大自然 保持 ....... |
| .... |
........ |
| 6 |
社区 小时 热贴 推荐 欢迎 来到 河南 心情 时时 舒展 欢迎 加入 河南 版友 群 |
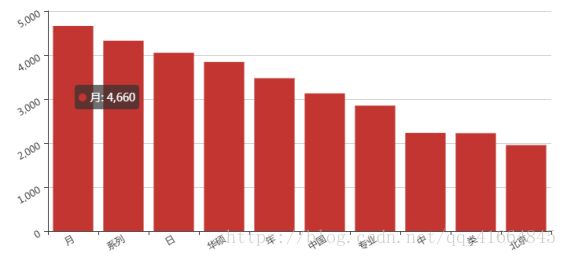
分词后需要去除停用词,如图展示的是对未去除停用词的词频统计(TOP10):
可以发现在没有去停用词操作前,文档中出现大量‘的’,‘在’,‘是’这类词,但是其对分类贡献率极低。通过去除停用词我们可以得到下面结果:
4.5 分类器模块功能实现
1 CNN
深度学习的CNN算法项目中使用到了python的第三方库keras,keras为使用TensorFlow提供的一定的便捷化的接口。它一定程度上降低了我们学习的难度,项目中使用keras可以便捷的构架神经网络,而不用耗费大量的时间去学习TensorFlow的编码解码及构建特征的编程方法。
在配置参数上我们选择100作为每条新闻的最大长度,单词的向量空间维度为200,20%的数据作为测试集以及16%的数据作为验证集。
a. 不使用word2vec算法训练cnn模型步骤:
·使用Tokenizer对所有文本数据做特征提取。将新闻的文本数据转化成由单词的索引对应的序列。
·按配置参数的比例分割训练集,验证集,测试集。
·通过embedding技术对新闻特征序列降维,生成100*200的二维向量矩阵。
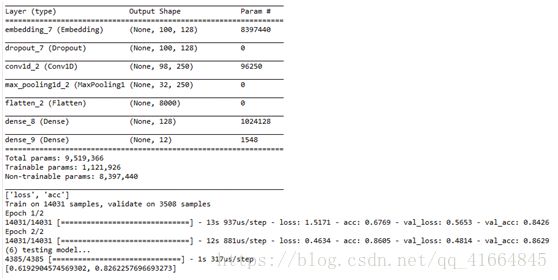
· 设置1 层卷积层与池化层减少向量的长度,,通过一层 Flatten 层将 2 维向量压缩到 1 维,最后由两层Dense将向量长度收缩到 11 上,对应新闻数据集的 11 个类类别。
实验结果如下:
训练集准确率:0.8652
准确率为:0.81450513
耗时:96s
对11个新闻类别的分类通过简单的搭建一个神经网络达到81%,但是从测试集准确度88%来看,存在一定的过拟合现象。总体来说在训练的时间偏长,效率较低。
b. 使用word2vec算法的CNN模型步骤:
· 使用 word2vec 模型替代embedding层的1312 万个参数。替换后embedding矩阵为65604 x 200。65604表示65604个单词。
· 其余步骤如上所示。
实验结果:
训练集准确度:0.8629
测试集准确度:0.8262257
耗时:77s
模型的shape与之前一样,过拟合现象减轻,准确率由原来的81%提升到了85.3%,这说明具备语义推理能力的word2vec可以一定程度上提高模型的准确率和运算性能。
2 LSTM
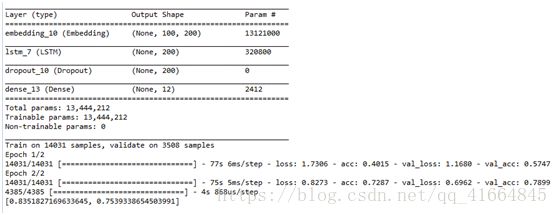
LSTM是深度学习算法中相对比较适合文本分类的一个模型,这里以同样的方法通过keras搭建LSTM网络。
a. 不使用word2vec算法训练LSTM模型
使用LSTM构架神经网络的步骤和参数与CNN的相同,这里不再做详细说明。
在训练集的准确率:0.7899
在测试集的准确率:0.7539733
耗时:161.9S
由于训练的数据量偏小,LSTM并没有发挥出其在自然语言处理上的优势,另外使用LSTM训练模型的时间为CNN的2倍,略为低效。
b. 使用word2vec算法的LSTM模型:
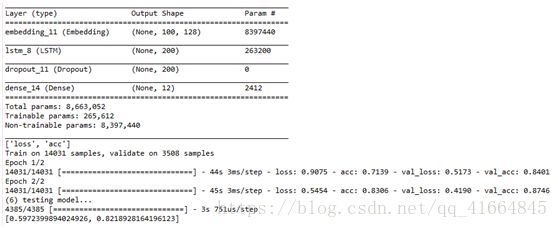
在训练集的准确率:0.8746
在测试集的准确率:0.821892816
耗时:162S
间接说明新闻文档的数量对LSTM的影响,使用word2vec产生的大量参数提升了语料库的容量。使得准确率有所提升。
3.朴素贝叶斯
贝叶斯算法我们使用python的机器学习库scikit-learn来完成,传统的机器学习模型,我们不用将词向量模型构建成二维的矩阵,来以分析图像的思维来训练文本,处理后的原数据矩阵为65604*1。
a. 使用TF-IDF算法建立贝叶斯模型:
使用TF-IDF来做特征提取,这里我们使用CountVectorizer来建立特征语料库,语料库的数量为文档出现所有词的集合。
将测试集与训练集分布与之拟合:
因为提前分割了数据集,所以在使用TF-IDF做特征提取的时候需要主要词对应语料库的位置。应当使用总得语料库来拟合训练集与测试。如果分开拟合将导致训练集与测试集相同索引对应不同单词,从而造成较大的误差。最后使用朴素贝叶斯算法建模,用测试集来验证贝叶斯模型的准确率。
简单的贝叶斯模型,准确率却略高于LSTM,而且在运行时间上,贝叶斯模型的运行时间不到2S,是LSTM的90分之一。
b. 使用word2vec训练贝叶斯模型:
配置参数为,100的新闻文章最大长度,N为4的字流窗大小,使用多核cpu加速,使用skip-gram做特征提取,迭代次数为10次。
Word2vel处理后的文本矩阵:
每个字对应了大量的权重,且由于word2vec赋予产生的矩阵一种连续性,使用朴素贝叶斯将不能处理这些连续得向量矩阵,这里我们使用高斯贝叶斯,假设矩阵满足正态分布。
训练结果如下:
训练正确率出其的低,且耗时为朴素贝叶斯模型的22倍。从直观的想法中,朴素贝叶斯正确率偏高,而使用word2vec将贝叶斯的单词独立性的假设得到了补充,按理应该正确率得到提升。下一章实验结果展示将会讨论这个问题。
4. Svm
Svm处理思路与朴素贝叶斯相同,这里指明一下,项目中SVM使用线性核。这是对比过高斯与多项式得出的。
a. 使用TF-IDF算法建立SVM模型:
由于特征构建原理相同,这里不做解释,详细可以参考上面贝叶斯的文档。
正确率:84.4% 虽不及贝叶斯,但是整体效果还是不错的。
b. 使用word2vec算法建立SVM模型:
正确率只有77.08%,但是相较word2vec在高斯贝叶斯模型模型的表现已经很好了。相同参数下,运行时间上达到了134.9s,效率很低。
4.4系统界面的实现
系统界面使用python的Django服务器框架开发,使用python原生的sqlite3作为数据库支持。前端使用JavaScript,CSS建立了一个较为简约的UI界面。主页建立了一个发布按钮。
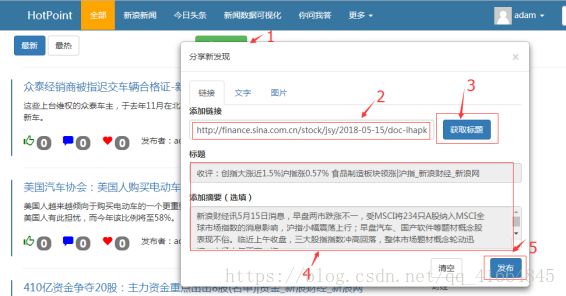
点击发布按钮(1),产生如图一个弹框:
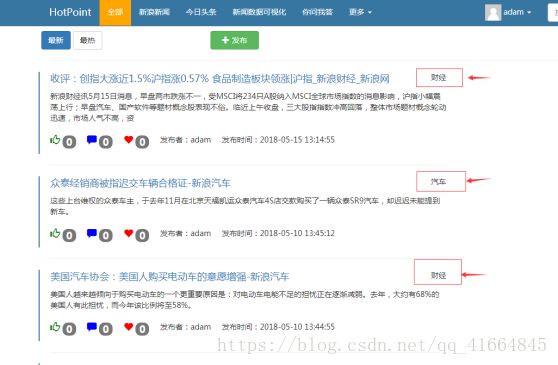
弹框中,添加链接这栏可以添加一个URL(2),因为本系统是针对新浪新闻而开发的,使用目前仅支持对新浪新闻相应链接的提取。添加链接后,点击获取标题(3),可以自动爬取对应的新闻标题和对应的摘要(4),点击发布按钮(5)。系统后台接收新闻标题与对应的摘要,经过分词后,通过与TF-IDF算法特征提取保存的单词及对应TF-IDF值矩阵匹配,转化成向量矩阵。这个向量矩阵,再与我们离线训练出来的贝叶斯模型,通过贝叶斯算法计算其所属类别的概率,达到预测的目的。
观察上图可以发现,贝叶斯算法具有较高的准确率,可以做到良好的分类效果。
第五章 实验结果分析
5.1 系统评估指标(ROC,AUC,训练所需时间)
a. ROC,AUC
在介绍系统评估指标前,我们先了解4个概念:
·True Positive(TP):意思是对于某一个类别的新闻信息,算法对新闻信息做出预测,且预测类别与此类别相同,TP的值表示预测该类别相同的个数。
·False Positive(FP):数值表示预测某一类别预测类别与真实类别不同的个数;
·True Negative(TN):数值表示预测某一类别预测为此类别,但是真实值非此类别的个数;
·False Negative(FN):数值表示预测某一类别预测为非此类别,且真实值也非此类别的个数;
基于此,我们就可以计算出准确率(precision rate)、召回率(recall rate)。
![]()
![]()
|
|
|
预测类别 |
|
|
真实结果 |
|
财经 |
非财经 |
| 财经 |
170(TP) |
300(FN) |
|
| 非财经 |
30(FP) |
1700(TN) |
|
以上表为例,TP的值为200,FN的值为30,FP的值为300,TN的值为2000。
那么, 准确率=170/(170+30) = 85% ,召回率=170/(170+300)= 36.17%。
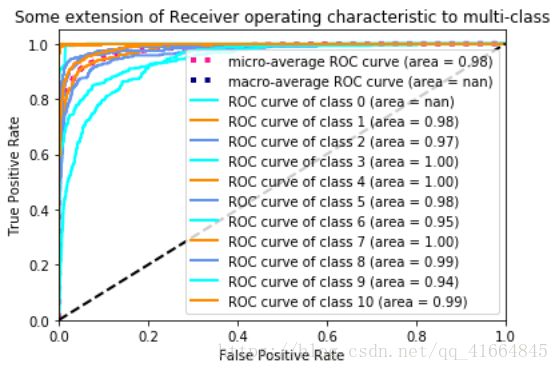
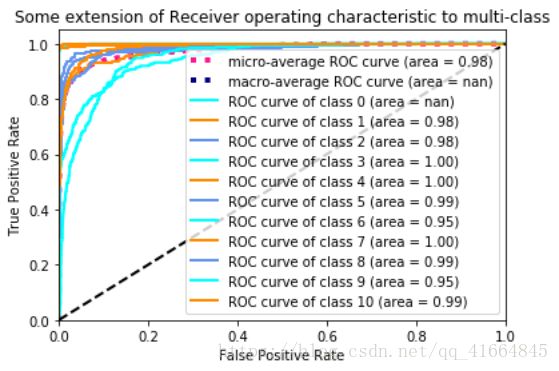
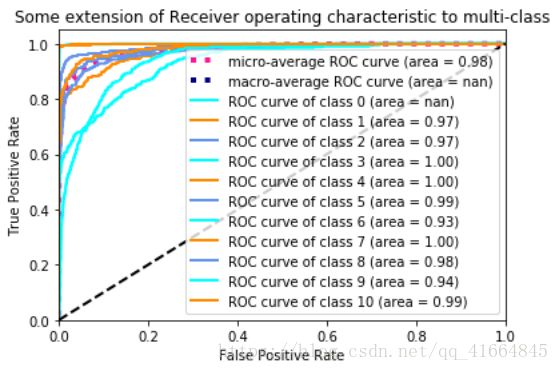
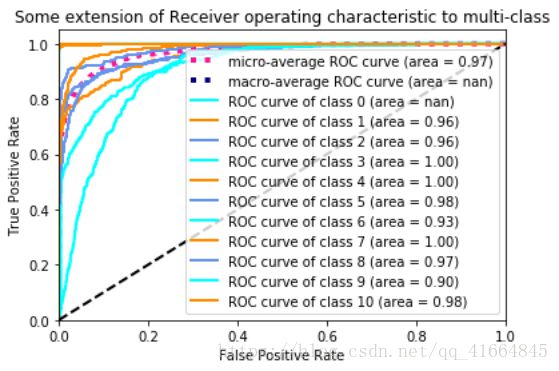
ROC曲线就是准确率随召回率的变化情况。ROC曲线越接近左上角,分类效果越好。AUC曲线表示ROC曲线下的面积,AUC面积越大,分类效果越好
5.2 算法拟合数据集说明
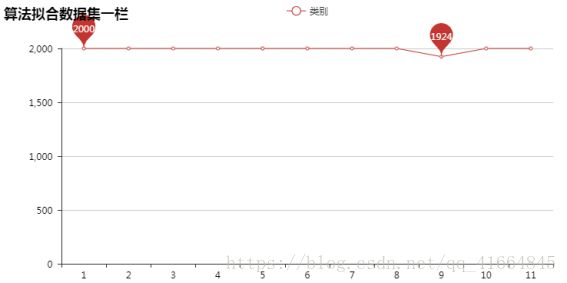
为了让算法能够均匀计算到每个类别,项目数据集上选择从每个类别中随机抽取2000条新闻数据进行算法拟合。其中文化类别只爬取到1924条,所以使用对文化类别选取全部的1924条作为样本。
类别字典映射表如下:
| 汽车 |
财经 |
IT |
健康 |
体育 |
旅游 |
教育 |
军事 |
文化 |
娱乐 |
时尚 |
| 1 |
2 |
3 |
4 |
5 |
6 |
7 |
8 |
9 |
10 |
11 |
在深度学习算法CNN,LSTM中选择20%的数据作为测试集以及16%的数据作为验证集。
在传统机器学习算法中,我们选择80%的数据作为训练集,20%的数据作为验证集。
5.3 分类系统算法评估
| 算法 |
准确度 |
训练所需时间 |
| 朴素贝叶斯+TF-IDF |
0.85430157 |
<2s |
| SVM+TF-IDF |
0.84435707 |
45s |
| CNN+word2vec |
0.8262257 |
77s |
| LSTM+word2vec |
0.821892816 |
172s |
| CNN+Tokenizer |
0.8150513 |
96s |
| SVM+word2vec |
0.77081406 |
23s |
| LSTM+Tokenizer |
0.7539733 |
161.9s |
| 朴素贝叶斯+word2vec |
0.5790934 |
13s |
朴素贝叶斯算法+TF-IDF ROC曲线:
SVM算法+TF-IDF ROC曲线:
CNN算法word2vec ROC曲线:
LSTM算法word2vec ROC曲线:
通过对比训练所需时间,朴素贝叶斯算法配合TF-IDF只需要2S就能完成对1万4千多条信息的数学建模。且对比不同算法模型的ROC图,贝叶斯算法综合下来ROC曲线最接近左上角,分类效果最好。ROC曲线下的面积对比中,朴素贝叶斯AUC面积最大大,分类效果最好。
由此判断,朴素贝叶斯配合TF-IDF是最为适合作为本项目新闻分类器的算法模型。其算法成功率为0.85430157,也支持对大量新闻数据的分类预测。
源码:
深度学习使用到的语料库为维基百科训练出来的语料库。
CNN:
#coding:utf-8
import sys
import keras
import matplotlib.pyplot as plt


VECTOR_DIR = 'vectors.bin'


MAX_SEQUENCE_LENGTH = 100
EMBEDDING_DIM = 200
VALIDATION_SPLIT = 0.16
TEST_SPLIT = 0.2


print ('(1) load texts...')
train_texts = open('train_contents.txt',encoding='utf-8').read().split('\n')
train_labels = open('train_labels.txt',encoding='utf-8').read().split('\n')
test_texts = open('test_contents.txt',encoding='utf-8').read().split('\n')
test_labels = open('test_labels.txt',encoding='utf-8').read().split('\n')
all_texts = train_texts + test_texts
all_labels = train_labels + test_labels


print ('(2) doc to var...')
from keras.preprocessing.text import Tokenizer
from keras.preprocessing.sequence import pad_sequences
from keras.utils import to_categorical
import numpy as np


tokenizer = Tokenizer()
tokenizer.fit_on_texts(all_texts)
sequences = tokenizer.texts_to_sequences(all_texts)
word_index = tokenizer.word_index
print('Found %s unique tokens.' % len(word_index))
data = pad_sequences(sequences, maxlen=MAX_SEQUENCE_LENGTH)
labels = to_categorical(np.asarray(all_labels))
print('Shape of data tensor:', data.shape)
print('Shape of label tensor:', labels.shape)


print ('(3) split data set...')
# split the data into training set, validation set, and test set
p1 = int(len(data)*(1-VALIDATION_SPLIT-TEST_SPLIT))
p2 = int(len(data)*(1-TEST_SPLIT))
x_train = data[:p1]
y_train = labels[:p1]
x_val = data[p1:p2]
y_val = labels[p1:p2]
x_test = data[p2:]
y_test = labels[p2:]
print ('train docs: '+str(len(x_train)))
print ('val docs: '+str(len(x_val)))
print ('test docs: '+str(len(x_test)))


print ('(5) training model...')
from keras.layers import Dense, Input, Flatten, Dropout
from keras.layers import Conv1D, MaxPooling1D, Embedding, GlobalMaxPooling1D
from keras.models import Sequential


model = Sequential()
model.add(Embedding(len(word_index) + 1, EMBEDDING_DIM, input_length=MAX_SEQUENCE_LENGTH))
model.add(Dropout(0.2))
model.add(Conv1D(250, 3, padding='valid', activation='relu', strides=1))
model.add(MaxPooling1D(3))
model.add(Flatten())
model.add(Dense(EMBEDDING_DIM, activation='relu'))
model.add(Dense(labels.shape[1], activation='softmax'))
model.summary()
#plot_model(model, to_file='model.png',show_shapes=True)


model.compile(loss='categorical_crossentropy',
              optimizer='rmsprop',
              metrics=['acc'])
print (model.metrics_names)
model.fit(x_train, y_train, callbacks=[history],validation_data=(x_val, y_val), epochs=2, batch_size=128)
#model.save('cnn.h5')


print ('(6) testing model...')
print (model.evaluate(x_test, y_test))


import matplotlib.pyplot as plt
from sklearn.metrics import roc_curve,auc
import numpy as np
from scipy import interp


y_score  = model.predict(x_test)
lw = 2
n_classes = 11
fpr = dict()
tpr = dict()
roc_auc = dict()
for i in range(n_classes):
    fpr[i], tpr[i], _ = roc_curve(y_test[:, i], y_score[:, i])
    roc_auc[i] = auc(fpr[i], tpr[i])


# Compute micro-average ROC curve and ROC area
fpr["micro"], tpr["micro"], _ = roc_curve(y_test.ravel(), y_score.ravel())
roc_auc["micro"] = auc(fpr["micro"], tpr["micro"])


# Compute macro-average ROC curve and ROC area


# First aggregate all false positive rates
all_fpr = np.unique(np.concatenate([fpr[i] for i in range(n_classes)]))


# Then interpolate all ROC curves at this points
mean_tpr = np.zeros_like(all_fpr)
for i in range(n_classes):
    mean_tpr += interp(all_fpr, fpr[i], tpr[i])


# Finally average it and compute AUC
mean_tpr /= n_classes


fpr["macro"] = all_fpr
tpr["macro"] = mean_tpr
roc_auc["macro"] = auc(fpr["macro"], tpr["macro"])


# Plot all ROC curves
plt.figure()
plt.plot(fpr["micro"], tpr["micro"],
         label='micro-average ROC curve (area = {0:0.2f})'
               ''.format(roc_auc["micro"]),
         color='deeppink', linestyle=':', linewidth=4)


plt.plot(fpr["macro"], tpr["macro"],
         label='macro-average ROC curve (area = {0:0.2f})'
               ''.format(roc_auc["macro"]),
         color='navy', linestyle=':', linewidth=4)


colors = cycle(['aqua', 'darkorange', 'cornflowerblue'])
for i, color in zip(range(n_classes), colors):
    plt.plot(fpr[i], tpr[i], color=color, lw=lw,
             label='ROC curve of class {0} (area = {1:0.2f})'
             ''.format(i, roc_auc[i]))


plt.plot([0, 1], [0, 1], 'k--', lw=lw)
plt.xlim([0.0, 1.0])
plt.ylim([0.0, 1.05])
plt.xlabel('False Positive Rate')
plt.ylabel('True Positive Rate')
plt.title('Some extension of Receiver operating characteristic to multi-class')
plt.legend(loc="lower right")
plt.show()
CNN+word2vec
#coding:utf-8
import sys
import keras


VECTOR_DIR = 'vectors.bin'


MAX_SEQUENCE_LENGTH = 100
EMBEDDING_DIM = 128
VALIDATION_SPLIT = 0.16
TEST_SPLIT = 0.2


print ('(1) load texts...')
train_texts = open('train_contents.txt',encoding='utf-8').read().split('\n')
train_labels = open('train_labels.txt',encoding='utf-8').read().split('\n')
test_texts = open('test_contents.txt',encoding='utf-8').read().split('\n')
test_labels = open('test_labels.txt',encoding='utf-8').read().split('\n')
all_texts = train_texts + test_texts
all_labels = train_labels + test_labels


print ('(2) doc to var...')
from keras.preprocessing.text import Tokenizer
from keras.preprocessing.sequence import pad_sequences
from keras.utils import to_categorical
import numpy as np


tokenizer = Tokenizer()
tokenizer.fit_on_texts(all_texts)
sequences = tokenizer.texts_to_sequences(all_texts)
word_index = tokenizer.word_index
print('Found %s unique tokens.' % len(word_index))
data = pad_sequences(sequences, maxlen=MAX_SEQUENCE_LENGTH)
labels = to_categorical(np.asarray(all_labels))
print('Shape of data tensor:', data.shape)
print('Shape of label tensor:', labels.shape)


print ('(3) split data set...')
# split the data into training set, validation set, and test set
p1 = int(len(data)*(1-VALIDATION_SPLIT-TEST_SPLIT))
p2 = int(len(data)*(1-TEST_SPLIT))
x_train = data[:p1]
y_train = labels[:p1]
x_val = data[p1:p2]
y_val = labels[p1:p2]
x_test = data[p2:]
y_test = labels[p2:]
print ('train docs: '+str(len(x_train)))
print ('val docs: '+str(len(x_val)))
print ('test docs: '+str(len(x_test)))


print ('(4) load word2vec as embedding...')


import gensim
from keras.utils import plot_model
w2v_model = gensim.models.KeyedVectors.load_word2vec_format(VECTOR_DIR, binary=True)
embedding_matrix = np.zeros((len(word_index) + 1, EMBEDDING_DIM))
not_in_model = 0
in_model = 0
for word, i in word_index.items():
    if word in w2v_model:
        in_model += 1
        embedding_matrix[i] = np.asarray(w2v_model[word], dtype='float32')
    else:
        not_in_model += 1
print (str(not_in_model)+' words not in w2v model')
from keras.layers import Embedding
embedding_layer = Embedding(len(word_index) + 1,
                            EMBEDDING_DIM,
                            weights=[embedding_matrix],
                            input_length=MAX_SEQUENCE_LENGTH,
                            trainable=False)


print ('(5) training model...')
from keras.layers import Dense, Input, Flatten, Dropout
from keras.layers import Conv1D, MaxPooling1D, Embedding, GlobalMaxPooling1D
from keras.models import Sequential


model = Sequential()
model.add(embedding_layer)
model.add(Dropout(0.2))
model.add(Conv1D(250, 3, padding='valid', activation='relu', strides=1))
model.add(MaxPooling1D(3))
model.add(Flatten())
model.add(Dense(EMBEDDING_DIM, activation='relu'))
model.add(Dense(labels.shape[1], activation='softmax'))
model.summary()
#plot_model(model, to_file='model.png',show_shapes=True)


model.compile(loss='categorical_crossentropy',
              optimizer='rmsprop',
              metrics=['acc'])
print( model.metrics_names)
model.fit(x_train, y_train, validation_data=(x_test, y_test), epochs=2, batch_size=128)
model.save('word_vector_cnn.h5')


print ('(6) testing model...')
print (model.evaluate(x_test, y_test))


import matplotlib.pyplot as plt
from sklearn.metrics import roc_curve,auc
import numpy as np
from scipy import interp


y_score  = model.predict(x_test)
lw = 2
n_classes = 11
fpr = dict()
tpr = dict()
roc_auc = dict()
for i in range(n_classes):
    fpr[i], tpr[i], _ = roc_curve(y_test[:, i], y_score[:, i])
    roc_auc[i] = auc(fpr[i], tpr[i])


# Compute micro-average ROC curve and ROC area
fpr["micro"], tpr["micro"], _ = roc_curve(y_test.ravel(), y_score.ravel())
roc_auc["micro"] = auc(fpr["micro"], tpr["micro"])


# Compute macro-average ROC curve and ROC area


# First aggregate all false positive rates
all_fpr = np.unique(np.concatenate([fpr[i] for i in range(n_classes)]))


# Then interpolate all ROC curves at this points
mean_tpr = np.zeros_like(all_fpr)
for i in range(n_classes):
    mean_tpr += interp(all_fpr, fpr[i], tpr[i])


# Finally average it and compute AUC
mean_tpr /= n_classes


fpr["macro"] = all_fpr
tpr["macro"] = mean_tpr
roc_auc["macro"] = auc(fpr["macro"], tpr["macro"])


# Plot all ROC curves
plt.figure()
plt.plot(fpr["micro"], tpr["micro"],
         label='micro-average ROC curve (area = {0:0.2f})'
               ''.format(roc_auc["micro"]),
         color='deeppink', linestyle=':', linewidth=4)


plt.plot(fpr["macro"], tpr["macro"],
         label='macro-average ROC curve (area = {0:0.2f})'
               ''.format(roc_auc["macro"]),
         color='navy', linestyle=':', linewidth=4)


colors = cycle(['aqua', 'darkorange', 'cornflowerblue'])
for i, color in zip(range(n_classes), colors):
    plt.plot(fpr[i], tpr[i], color=color, lw=lw,
             label='ROC curve of class {0} (area = {1:0.2f})'
             ''.format(i, roc_auc[i]))


plt.plot([0, 1], [0, 1], 'k--', lw=lw)
plt.xlim([0.0, 1.0])
plt.ylim([0.0, 1.05])
plt.xlabel('False Positive Rate')
plt.ylabel('True Positive Rate')
plt.title('Some extension of Receiver operating characteristic to multi-class')
plt.legend(loc="lower right")
plt.show()
LSTM
#coding:utf-8


import keras
import matplotlib.pyplot as plt
VECTOR_DIR = 'vectors.bin'


MAX_SEQUENCE_LENGTH = 100
EMBEDDING_DIM = 200
VALIDATION_SPLIT = 0.16
TEST_SPLIT = 0.2


print ('(1) load texts...')
train_texts = open('train_contents.txt',encoding='utf-8').read().split('\n')
train_labels = open('train_labels.txt',encoding='utf-8').read().split('\n')
test_texts = open('test_contents.txt',encoding='utf-8').read().split('\n')
test_labels = open('test_labels.txt',encoding='utf-8').read().split('\n')
all_texts = train_texts + test_texts
all_labels = train_labels + test_labels


print ('(2) doc to var...')
from keras.preprocessing.text import Tokenizer
from keras.preprocessing.sequence import pad_sequences
from keras.utils import to_categorical
import numpy as np


tokenizer = Tokenizer()
tokenizer.fit_on_texts(all_texts)
sequences = tokenizer.texts_to_sequences(all_texts)
word_index = tokenizer.word_index
print('Found %s unique tokens.' % len(word_index))
data = pad_sequences(sequences, maxlen=MAX_SEQUENCE_LENGTH)
labels = to_categorical(np.asarray(all_labels))
print('Shape of data tensor:', data.shape)
print('Shape of label tensor:', labels.shape)


print ('(3) split data set...')
p1 = int(len(data)*(1-VALIDATION_SPLIT-TEST_SPLIT))
p2 = int(len(data)*(1-TEST_SPLIT))
x_train = data[:p1]
y_train = labels[:p1]
x_val = data[p1:p2]
y_val = labels[p1:p2]
x_test = data[p2:]
y_test = labels[p2:]
print ('train docs: '+str(len(x_train)))
print ('val docs: '+str(len(x_val)))
print ('test docs: '+str(len(x_test)))


from keras.layers import Dense, Input, Flatten, Dropout
from keras.layers import LSTM, Embedding
from keras.models import Sequential


model = Sequential()
model.add(Embedding(len(word_index) + 1, EMBEDDING_DIM, input_length=MAX_SEQUENCE_LENGTH))
model.add(LSTM(200, dropout=0.2, recurrent_dropout=0.2))
model.add(Dropout(0.2))
model.add(Dense(labels.shape[1], activation='softmax'))
model.summary()


model.compile(loss='categorical_crossentropy',
              optimizer='rmsprop',
              metrics=['acc'])


history = model.fit(x_train, y_train,validation_data=(x_val, y_val), epochs=2, batch_size=128)
#model.save('lstm.h5')


print (model.evaluate(x_test, y_test))


import matplotlib.pyplot as plt
from sklearn.metrics import roc_curve,auc
import numpy as np
from scipy import interp


y_score  = model.predict(x_test)
lw = 2
n_classes = 11
fpr = dict()
tpr = dict()
roc_auc = dict()
for i in range(n_classes):
    fpr[i], tpr[i], _ = roc_curve(y_test[:, i], y_score[:, i])
    roc_auc[i] = auc(fpr[i], tpr[i])


# Compute micro-average ROC curve and ROC area
fpr["micro"], tpr["micro"], _ = roc_curve(y_test.ravel(), y_score.ravel())
roc_auc["micro"] = auc(fpr["micro"], tpr["micro"])


# Compute macro-average ROC curve and ROC area


# First aggregate all false positive rates
all_fpr = np.unique(np.concatenate([fpr[i] for i in range(n_classes)]))


# Then interpolate all ROC curves at this points
mean_tpr = np.zeros_like(all_fpr)
for i in range(n_classes):
    mean_tpr += interp(all_fpr, fpr[i], tpr[i])


# Finally average it and compute AUC
mean_tpr /= n_classes


fpr["macro"] = all_fpr
tpr["macro"] = mean_tpr
roc_auc["macro"] = auc(fpr["macro"], tpr["macro"])


# Plot all ROC curves
plt.figure()
plt.plot(fpr["micro"], tpr["micro"],
         label='micro-average ROC curve (area = {0:0.2f})'
               ''.format(roc_auc["micro"]),
         color='deeppink', linestyle=':', linewidth=4)


plt.plot(fpr["macro"], tpr["macro"],
         label='macro-average ROC curve (area = {0:0.2f})'
               ''.format(roc_auc["macro"]),
         color='navy', linestyle=':', linewidth=4)


colors = cycle(['aqua', 'darkorange', 'cornflowerblue'])
for i, color in zip(range(n_classes), colors):
    plt.plot(fpr[i], tpr[i], color=color, lw=lw,
             label='ROC curve of class {0} (area = {1:0.2f})'
             ''.format(i, roc_auc[i]))


plt.plot([0, 1], [0, 1], 'k--', lw=lw)
plt.xlim([0.0, 1.0])
plt.ylim([0.0, 1.05])
plt.xlabel('False Positive Rate')
plt.ylabel('True Positive Rate')
plt.title('Some extension of Receiver operating characteristic to multi-class')
plt.legend(loc="lower right")
plt.show()
LSTM+word2vec
#coding:utf-8
import sys
import keras


VECTOR_DIR = 'vectors.bin'


MAX_SEQUENCE_LENGTH = 100
EMBEDDING_DIM = 128
VALIDATION_SPLIT = 0.16
TEST_SPLIT = 0.2


print ('(1) load texts...')
train_texts = open('train_contents.txt',encoding='utf-8').read().split('\n')
train_labels = open('train_labels.txt',encoding='utf-8').read().split('\n')
test_texts = open('test_contents.txt',encoding='utf-8').read().split('\n')
test_labels = open('test_labels.txt',encoding='utf-8').read().split('\n')
all_texts = train_texts + test_texts
all_labels = train_labels + test_labels


print ('(2) doc to var...')
from keras.preprocessing.text import Tokenizer
from keras.preprocessing.sequence import pad_sequences
from keras.utils import to_categorical
import numpy as np


tokenizer = Tokenizer()
tokenizer.fit_on_texts(all_texts)
sequences = tokenizer.texts_to_sequences(all_texts)
word_index = tokenizer.word_index
print('Found %s unique tokens.' % len(word_index))
data = pad_sequences(sequences, maxlen=MAX_SEQUENCE_LENGTH)
labels = to_categorical(np.asarray(all_labels))
print('Shape of data tensor:', data.shape)
print('Shape of label tensor:', labels.shape)


print ('(3) split data set...')
p1 = int(len(data)*(1-VALIDATION_SPLIT-TEST_SPLIT))
p2 = int(len(data)*(1-TEST_SPLIT))
x_train = data[:p1]
y_train = labels[:p1]
x_val = data[p1:p2]
y_val = labels[p1:p2]
x_test = data[p2:]
y_test = labels[p2:]
print ('train docs: '+str(len(x_train)))
print ('val docs: '+str(len(x_val)))
print ('test docs: '+str(len(x_test)))


print ('(4) load word2vec as embedding...')
import gensim
from keras.utils import plot_model
w2v_model = gensim.models.KeyedVectors.load_word2vec_format(VECTOR_DIR, binary=True)
embedding_matrix = np.zeros((len(word_index) + 1, EMBEDDING_DIM))
not_in_model = 0
in_model = 0
for word, i in word_index.items():
    if word in w2v_model:
        in_model += 1
        embedding_matrix[i] = np.asarray(w2v_model[word], dtype='float32')
    else:
        not_in_model += 1
print (str(not_in_model)+' words not in w2v model')
from keras.layers import Embedding
embedding_layer = Embedding(len(word_index) + 1,
                            EMBEDDING_DIM,
                            weights=[embedding_matrix],
                            input_length=MAX_SEQUENCE_LENGTH,
                            trainable=False)


print ('(5) training model...')
from keras.layers import Dense, Input, Flatten, Dropout
from keras.layers import LSTM, Embedding
from keras.models import Sequential


model = Sequential()
model.add(embedding_layer)
model.add(LSTM(200, dropout=0.2, recurrent_dropout=0.2))
model.add(Dropout(0.2))
model.add(Dense(labels.shape[1], activation='softmax'))
model.summary()
#plot_model(model, to_file='model.png',show_shapes=True)


model.compile(loss='categorical_crossentropy',
              optimizer='rmsprop',
              metrics=['acc'])
print (model.metrics_names)
model.fit(x_train, y_train, validation_data=(x_val, y_val), epochs=2, batch_size=128)
#model.save('word_vector_lstm.h5')


print ('(6) testing model...')
print (model.evaluate(x_test, y_test))


#画图
import matplotlib.pyplot as plt
from sklearn.metrics import roc_curve,auc
import numpy as np
from scipy import interp


y_score  = model.predict(x_test)
lw = 2
n_classes = 11
fpr = dict()
tpr = dict()
roc_auc = dict()
for i in range(n_classes):
    fpr[i], tpr[i], _ = roc_curve(y_test[:, i], y_score[:, i])
    roc_auc[i] = auc(fpr[i], tpr[i])


# Compute micro-average ROC curve and ROC area
fpr["micro"], tpr["micro"], _ = roc_curve(y_test.ravel(), y_score.ravel())
roc_auc["micro"] = auc(fpr["micro"], tpr["micro"])


# Compute macro-average ROC curve and ROC area


# First aggregate all false positive rates
all_fpr = np.unique(np.concatenate([fpr[i] for i in range(n_classes)]))


# Then interpolate all ROC curves at this points
mean_tpr = np.zeros_like(all_fpr)
for i in range(n_classes):
    mean_tpr += interp(all_fpr, fpr[i], tpr[i])


# Finally average it and compute AUC
mean_tpr /= n_classes


fpr["macro"] = all_fpr
tpr["macro"] = mean_tpr
roc_auc["macro"] = auc(fpr["macro"], tpr["macro"])


# Plot all ROC curves
plt.figure()
plt.plot(fpr["micro"], tpr["micro"],
         label='micro-average ROC curve (area = {0:0.2f})'
               ''.format(roc_auc["micro"]),
         color='deeppink', linestyle=':', linewidth=4)


plt.plot(fpr["macro"], tpr["macro"],
         label='macro-average ROC curve (area = {0:0.2f})'
               ''.format(roc_auc["macro"]),
         color='navy', linestyle=':', linewidth=4)


colors = cycle(['aqua', 'darkorange', 'cornflowerblue'])
for i, color in zip(range(n_classes), colors):
    plt.plot(fpr[i], tpr[i], color=color, lw=lw,
             label='ROC curve of class {0} (area = {1:0.2f})'
             ''.format(i, roc_auc[i]))


plt.plot([0, 1], [0, 1], 'k--', lw=lw)
plt.xlim([0.0, 1.0])
plt.ylim([0.0, 1.05])
plt.xlabel('False Positive Rate')
plt.ylabel('True Positive Rate')
plt.title('Some extension of Receiver operating characteristic to multi-class')
plt.legend(loc="lower right")
plt.show()
朴素贝叶斯
#coding:utf-8


from sklearn.feature_extraction.text import CountVectorizer, TfidfTransformer
from sklearn.naive_bayes import MultinomialNB
from sklearn import metrics


train_texts = open('train_contents.txt',encoding='utf-8').read().split('\n')
train_labels = open('train_labels.txt',encoding='utf-8').read().split('\n')
test_texts = open('test_contents.txt',encoding='utf-8').read().split('\n')
test_labels = open('test_labels.txt',encoding='utf-8').read().split('\n')
all_text = train_texts + test_texts


count_v0= CountVectorizer();
counts_all = count_v0.fit_transform(all_text);
count_v1= CountVectorizer(vocabulary=count_v0.vocabulary_);
counts_train = count_v1.fit_transform(train_texts);
print ("the shape of train is "+repr(counts_train.shape) )
count_v2 = CountVectorizer(vocabulary=count_v0.vocabulary_);
counts_test = count_v2.fit_transform(test_texts);
print ("the shape of test is "+repr(counts_test.shape) )


tfidftransformer = TfidfTransformer();
train_data = tfidftransformer.fit(counts_train).transform(counts_train);
test_data = tfidftransformer.fit(counts_test).transform(counts_test);


x_train = train_data
y_train = train_labels
x_test = test_data
y_test = test_labels


clf = MultinomialNB(alpha = 0.01)
clf.fit(x_train, y_train);
preds = clf.predict(x_test);
num = 0
preds = preds.tolist()
for i,pred in enumerate(preds):
    if int(pred) == int(y_test[i]):
        num += 1
print ('precision_score:' + str(float(num) / len(preds)))


import matplotlib.pyplot as plt
from sklearn.metrics import roc_curve,auc
import numpy as np
from scipy import interp


y_score  = clf.predict(x_test)
lw = 2
n_classes = 11
fpr = dict()
tpr = dict()
roc_auc = dict()
for i in range(n_classes):
    fpr[i], tpr[i], _ = roc_curve(y_test[:, i], y_score[:, i])
    roc_auc[i] = auc(fpr[i], tpr[i])


# Compute micro-average ROC curve and ROC area
fpr["micro"], tpr["micro"], _ = roc_curve(y_test.ravel(), y_score.ravel())
roc_auc["micro"] = auc(fpr["micro"], tpr["micro"])


# Compute macro-average ROC curve and ROC area


# First aggregate all false positive rates
all_fpr = np.unique(np.concatenate([fpr[i] for i in range(n_classes)]))


# Then interpolate all ROC curves at this points
mean_tpr = np.zeros_like(all_fpr)
for i in range(n_classes):
    mean_tpr += interp(all_fpr, fpr[i], tpr[i])


# Finally average it and compute AUC
mean_tpr /= n_classes


fpr["macro"] = all_fpr
tpr["macro"] = mean_tpr
roc_auc["macro"] = auc(fpr["macro"], tpr["macro"])


# Plot all ROC curves
plt.figure()
plt.plot(fpr["micro"], tpr["micro"],
         label='micro-average ROC curve (area = {0:0.2f})'
               ''.format(roc_auc["micro"]),
         color='deeppink', linestyle=':', linewidth=4)


plt.plot(fpr["macro"], tpr["macro"],
         label='macro-average ROC curve (area = {0:0.2f})'
               ''.format(roc_auc["macro"]),
         color='navy', linestyle=':', linewidth=4)


colors = cycle(['aqua', 'darkorange', 'cornflowerblue'])
for i, color in zip(range(n_classes), colors):
    plt.plot(fpr[i], tpr[i], color=color, lw=lw,
             label='ROC curve of class {0} (area = {1:0.2f})'
             ''.format(i, roc_auc[i]))


plt.plot([0, 1], [0, 1], 'k--', lw=lw)
plt.xlim([0.0, 1.0])
plt.ylim([0.0, 1.05])
plt.xlabel('False Positive Rate')
plt.ylabel('True Positive Rate')
plt.title('Some extension of Receiver operating characteristic to multi-class')
plt.legend(loc="lower right")
plt.show()
高斯贝叶斯+word2vec
#coding:utf-8
from sklearn.naive_bayes import MultinomialNB
from sklearn.preprocessing import scale
from sklearn.naive_bayes import GaussianNB


VECTOR_DIR = 'vectors.bin'


MAX_SEQUENCE_LENGTH = 100
EMBEDDING_DIM = 128
TEST_SPLIT = 0.2


print ('(1) load texts...')
train_docs = open('train_contents.txt',encoding = 'utf-8').read().split('\n')
train_labels = open('train_labels.txt',encoding = 'utf-8').read().split('\n')
test_docs = open('test_contents.txt',encoding = 'utf-8').read().split('\n')
test_labels = open('test_labels.txt',encoding = 'utf-8').read().split('\n')


print ('(2) doc to var...')
import gensim
import numpy as np
w2v_model = gensim.models.KeyedVectors.load_word2vec_format(VECTOR_DIR, binary=True)


def buildWordVector(text, size):
    '''
        利用函数获得每个文本中所有词向量的平均值来表征该特征向量。
    '''
    vec = np.zeros(128).reshape((1, size))
    count = 0
    for word in text:
        try:
            vec += w2v_model[word].reshape((1, 128))
            count += 1
        except KeyError:
            continue
    if count != 0:
        vec /= count
    return vec

'''获取需要所有文档的词向量,并且标准化出来'''
x_train1 = np.concatenate([buildWordVector(x, 128) for x in train_docs])
print ("the shape of train is "+repr(x_train1.shape) )
x_train = scale(x_train1)
x_test1 = np.concatenate([buildWordVector(x, 128) for x in test_docs])
print ("the shape of train is "+repr(x_test1.shape) )
x_test = scale(x_test1)
y_train = train_labels
y_test = test_labels


clf = GaussianNB()
clf.fit(x_train, y_train);
preds = clf.predict(x_test);
num = 0
preds = preds.tolist()
for i,pred in enumerate(preds):
    if int(pred) == int(y_test[i]):
        num += 1
print ('precision_score:' + str(float(num) / len(preds)))
SVM
#coding:utf-8
import sys
VECTOR_DIR = 'vectors.bin'


MAX_SEQUENCE_LENGTH = 100
EMBEDDING_DIM = 200
TEST_SPLIT = 0.2


print ('(1) load texts...')
train_texts = open('train_contents.txt',encoding='utf-8').read().split('\n')
train_labels = open('train_labels.txt',encoding='utf-8').read().split('\n')
test_texts = open('test_contents.txt',encoding='utf-8').read().split('\n')
test_labels = open('test_labels.txt',encoding='utf-8').read().split('\n')
all_text = train_texts + test_texts


print ('(2) doc to var...')
from sklearn.feature_extraction.text import CountVectorizer, TfidfTransformer
count_v0= CountVectorizer();
counts_all = count_v0.fit_transform(all_text);
count_v1= CountVectorizer(vocabulary=count_v0.vocabulary_);
counts_train = count_v1.fit_transform(train_texts);
print ("the shape of train is "+repr(counts_train.shape) )
count_v2 = CountVectorizer(vocabulary=count_v0.vocabulary_);
counts_test = count_v2.fit_transform(test_texts);
print ("the shape of test is "+repr(counts_test.shape) )

tfidftransformer = TfidfTransformer();
train_data = tfidftransformer.fit(counts_train).transform(counts_train);
test_data = tfidftransformer.fit(counts_test).transform(counts_test);


x_train = train_data
y_train = train_labels
x_test = test_data
y_test = test_labels


print ('(3) SVM...')
from sklearn.svm import SVC
svclf = SVC(kernel = 'linear')
svclf.fit(x_train,y_train)
preds = svclf.predict(x_test);
num = 0
preds = preds.tolist()
for i,pred in enumerate(preds):
    if int(pred) == int(y_test[i]):
        num += 1
print ('precision_score:' + str(float(num) / len(preds)))


import matplotlib.pyplot as plt
from sklearn.metrics import roc_curve,auc
import numpy as np
from scipy import interp


y_score  = clf.predict(x_test)
lw = 2
n_classes = 11
fpr = dict()
tpr = dict()
roc_auc = dict()
for i in range(n_classes):
    fpr[i], tpr[i], _ = roc_curve(y_test[:, i], y_score[:, i])
    roc_auc[i] = auc(fpr[i], tpr[i])


# Compute micro-average ROC curve and ROC area
fpr["micro"], tpr["micro"], _ = roc_curve(y_test.ravel(), y_score.ravel())
roc_auc["micro"] = auc(fpr["micro"], tpr["micro"])


# Compute macro-average ROC curve and ROC area


# First aggregate all false positive rates
all_fpr = np.unique(np.concatenate([fpr[i] for i in range(n_classes)]))


# Then interpolate all ROC curves at this points
mean_tpr = np.zeros_like(all_fpr)
for i in range(n_classes):
    mean_tpr += interp(all_fpr, fpr[i], tpr[i])


# Finally average it and compute AUC
mean_tpr /= n_classes


fpr["macro"] = all_fpr
tpr["macro"] = mean_tpr
roc_auc["macro"] = auc(fpr["macro"], tpr["macro"])


# Plot all ROC curves
plt.figure()
plt.plot(fpr["micro"], tpr["micro"],
         label='micro-average ROC curve (area = {0:0.2f})'
               ''.format(roc_auc["micro"]),
         color='deeppink', linestyle=':', linewidth=4)


plt.plot(fpr["macro"], tpr["macro"],
         label='macro-average ROC curve (area = {0:0.2f})'
               ''.format(roc_auc["macro"]),
         color='navy', linestyle=':', linewidth=4)


colors = cycle(['aqua', 'darkorange', 'cornflowerblue'])
for i, color in zip(range(n_classes), colors):
    plt.plot(fpr[i], tpr[i], color=color, lw=lw,
             label='ROC curve of class {0} (area = {1:0.2f})'
             ''.format(i, roc_auc[i]))


plt.plot([0, 1], [0, 1], 'k--', lw=lw)
plt.xlim([0.0, 1.0])
plt.ylim([0.0, 1.05])
plt.xlabel('False Positive Rate')
plt.ylabel('True Positive Rate')
plt.title('Some extension of Receiver operating characteristic to multi-class')
plt.legend(loc="lower right")
plt.show()
SVM+word2vec
#coding:utf-8


from sklearn.preprocessing import scale


VECTOR_DIR = 'vectors.bin'


MAX_SEQUENCE_LENGTH = 100
EMBEDDING_DIM = 200
TEST_SPLIT = 0.2


print ('(1) load texts...')
train_docs = open('train_contents.txt',encoding = 'utf-8').read().split('\n')
train_labels = open('train_labels.txt',encoding = 'utf-8').read().split('\n')
test_docs = open('test_contents.txt',encoding = 'utf-8').read().split('\n')
test_labels = open('test_labels.txt',encoding = 'utf-8').read().split('\n')


print ('(2) doc to var...')
import gensim
import numpy as np
w2v_model = gensim.models.KeyedVectors.load_word2vec_format(VECTOR_DIR, binary=True)


def buildWordVector(text, size):
    '''
        利用函数获得每个文本中所有词向量的平均值来表征该特征向量。
    '''
    vec = np.zeros(128).reshape((1, size))
    count = 0
    for word in text:
        try:
            vec += w2v_model[word].reshape((1, 128))
            count += 1
        except KeyError:
            continue
    if count != 0:
        vec /= count
    return vec


'''获取需要所有文档的词向量,并且标准化出来'''
x_train1 = np.concatenate([buildWordVector(x, 128) for x in train_docs])
x_train = scale(x_train1)
x_test1 = np.concatenate([buildWordVector(x, 128) for x in test_docs])
x_test = scale(x_test1)
y_train = train_labels
y_test = test_labels


print ('(3) SVM...')
from sklearn.svm import SVC
svclf = SVC(kernel = 'linear')
svclf.fit(x_train,y_train)
preds = svclf.predict(x_test);
num = 0
preds = preds.tolist()
for i,pred in enumerate(preds):
    if int(pred) == int(y_test[i]):
        num += 1
print ('precision_score:' + str(float(num) / len(preds)))


import matplotlib.pyplot as plt
from sklearn.metrics import roc_curve,auc
import numpy as np
from scipy import interp


y_score  = clf.predict(x_test)
lw = 2
n_classes = 11
fpr = dict()
tpr = dict()
roc_auc = dict()
for i in range(n_classes):
    fpr[i], tpr[i], _ = roc_curve(y_test[:, i], y_score[:, i])
    roc_auc[i] = auc(fpr[i], tpr[i])


# Compute micro-average ROC curve and ROC area
fpr["micro"], tpr["micro"], _ = roc_curve(y_test.ravel(), y_score.ravel())
roc_auc["micro"] = auc(fpr["micro"], tpr["micro"])


# Compute macro-average ROC curve and ROC area


# First aggregate all false positive rates
all_fpr = np.unique(np.concatenate([fpr[i] for i in range(n_classes)]))


# Then interpolate all ROC curves at this points
mean_tpr = np.zeros_like(all_fpr)
for i in range(n_classes):
    mean_tpr += interp(all_fpr, fpr[i], tpr[i])


# Finally average it and compute AUC
mean_tpr /= n_classes


fpr["macro"] = all_fpr
tpr["macro"] = mean_tpr
roc_auc["macro"] = auc(fpr["macro"], tpr["macro"])


# Plot all ROC curves
plt.figure()
plt.plot(fpr["micro"], tpr["micro"],
         label='micro-average ROC curve (area = {0:0.2f})'
               ''.format(roc_auc["micro"]),
         color='deeppink', linestyle=':', linewidth=4)


plt.plot(fpr["macro"], tpr["macro"],
         label='macro-average ROC curve (area = {0:0.2f})'
               ''.format(roc_auc["macro"]),
         color='navy', linestyle=':', linewidth=4)


colors = cycle(['aqua', 'darkorange', 'cornflowerblue'])
for i, color in zip(range(n_classes), colors):
    plt.plot(fpr[i], tpr[i], color=color, lw=lw,
             label='ROC curve of class {0} (area = {1:0.2f})'
             ''.format(i, roc_auc[i]))


plt.plot([0, 1], [0, 1], 'k--', lw=lw)
plt.xlim([0.0, 1.0])
plt.ylim([0.0, 1.05])
plt.xlabel('False Positive Rate')
plt.ylabel('True Positive Rate')
plt.title('Some extension of Receiver operating characteristic to multi-class')
plt.legend(loc="lower right")
plt.show()
打赏一下作者:
![]()

