个人收入预测——决策树详解
Dataset
决策树的一个优点是它可以处理变量之间有非线性关系的数据,而这种数据用前面的线性回归是不能做的。
- 本文的数据集是美国1994年的个人收入信息,这个数据还包含了婚姻状况,年龄以及工作类型等等。目标是要预测他们每年的收入与50k的关系{<=50:0,>50:1}
import pandas
income = pandas.read_csv("income.csv")
print(income.head(5))
'''
  age          workclass  fnlwgt   education  education_num  \
0   39          State-gov   77516   Bachelors             13
1   50   Self-emp-not-inc   83311   Bachelors             13
2   38            Private  215646     HS-grad              9
3   53            Private  234721        11th              7
4   28            Private  338409   Bachelors             13

        marital_status          occupation    relationship    race      sex  \
0        Never-married        Adm-clerical   Not-in-family   White     Male
1   Married-civ-spouse     Exec-managerial         Husband   White     Male
2             Divorced   Handlers-cleaners   Not-in-family   White     Male
3   Married-civ-spouse   Handlers-cleaners         Husband   Black     Male
4   Married-civ-spouse      Prof-specialty            Wife   Black   Female

   capital_gain  capital_loss  hours_per_week  native_country high_income
0          2174             0              40   United-States       <=50K
1             0             0              13   United-States       <=50K
2             0             0              40   United-States       <=50K
3             0             0              40   United-States       <=50K
4             0             0              40            Cuba       <=50K
'''
Converting Categorical Variables
- 数据集中有很多分类变量:比如workclass(string:State-gov, Self-emp-not-inc, Private),sex(Male,Female)等等。在进行决策树构造之前,我们利用 Categorical.from_array这个函数将分类变量都转换为数值型数据类型。
'''
包括education, marital_status, occupation, relationship, race, sex, native_country, 以及high_income)
'''
# Convert a single column from text categories into numbers.
col = pandas.Categorical.from_array(income["workclass"])
income["workclass"] = col.codes
print(income["workclass"].head(5))
'''
0    7
1    6
2    4
3    4
4    4
Name: workclass, dtype: int8
'''
for name in ["education", "marital_status", "occupation", "relationship", "race", "sex", "native_country", "high_income"]:
    col = pandas.Categorical.from_array(income[name])
income[name] = col.codes- Categorical.from_array函数将分类属性Series对象转换为数值型属性分类变量,其分类取值从string变为number.这样在长树过程中,原本是判断一个人workclass是否等于Private来进行分支,现在就是判断一个人的workclass是否等于4(Private这个分类变量被数值型数据4替代了)来进行分支。
Split
- 可以将决策树看成是一个数据流,数据从上往下开始按照一定的规则流入到每个分支,总之最后每个树枝上的数据流总量等于流进树根的数据总量。当树越深,流进每个树枝的流量就越小。我们需要做的是将同一种流量流进同一个叶子,并且该叶子有唯一标签。
Entropy
熵:是用来找到分裂属性的基础。在概率论中,信息熵给了我们一种度量不确定性的方式,是用来衡量随机变量不确定性的,熵就是信息的期望值。若待分类的事物可能划分在N类中,分别是x1,x2,……,xn,每一种取到的概率分别是P1,P2,……,Pn,那么X的熵就定义为:

其中b通常取2,熵值越高,则数据混合的种类越高,其蕴含的含义是一个变量可能的变化越多(反而跟变量具体的取值没有任何关系,只和值的种类多少以及发生概率有关),它携带的信息量就越大。看个例子:

它的熵计算如下:

计算一下整体的关于high_income这个属性的信息熵:
import math
# We'll do the same calculation we did above, but in Python.
# Passing 2 as the second parameter to math.log will take a base 2 log.
entropy = -(2/5 * math.log(2/5, 2) + 3/5 * math.log(3/5, 2))
print(entropy)
'''
0.9709505944546686
'''
prob_0 = income[income["high_income"] == 0].shape[0] / income.shape[0]
prob_1 = income[income["high_income"] == 1].shape[0] / income.shape[0]
income_entropy = -(prob_0 * math.log(prob_0, 2) + prob_1 * math.log(prob_1, 2))
'''
income_entropy : 0.7963839552022132
'''
Information Gain
由于前面提到熵代表着信息的复杂程度,熵越大,越混乱,而我们要将数据划分为纯净的数据块,因此需要找到熵降低最大的属性来划分数据,这就产生了信息增益,公式如下:
首先计算关于目标变量的信息熵,然后给定一个属性,通过这个属性将数据划分为几块(根据属性的取值个数来决定,当属性个数很大时,选取中位数将其划分为两块),分别计算这几块关于目标变量的信息熵,然后乘以权值(每块所占数据比例)。然后将二者相减,这就得到了信息增益(熵降低的值)。再看个属性取值较多的例子:

计算它的信息增益时,首先找到它的中位数,将属性划分为两块,<=50划分到左侧,>50划分到右侧。

import numpy

def calc_entropy(column):
    """
    Calculate entropy given a pandas Series, list, or numpy array.
    """
    # Compute the counts of each unique value in the column.
    counts = numpy.bincount(column)
    # Divide by the total column length to get a probability.
    probabilities = counts / len(column)

    # Initialize the entropy to 0.
    entropy = 0
    # Loop through the probabilities, and add each one to the total entropy.
    for prob in probabilities:
        if prob > 0:
            entropy += prob * math.log(prob, 2)

    return -entropy
income_entropy = calc_entropy(income["high_income"])
median_age = income["age"].median()

left_split = income[income["age"] <= median_age]
right_split = income[income["age"] > median_age]

age_information_gain = income_entropy - ((left_split.shape[0] / income.shape[0]) * calc_entropy(left_split["high_income"]) + ((right_split.shape[0] / income.shape[0]) * calc_entropy(right_split["high_income"])))
'''
age_information_gain : 0.047028661304691965
'''- numpy.bincount(A):传入一个非负整数数组A,然后计算数组中最大的整数值为N,返回一个长度为N+1的数组,分别记录着A中0到N的出现的次数。
Finding The Best Split
- 计算所有属性的信息增益,找到增益最大的那个属性
def calc_information_gain(data, split_name, target_name):
    """
    Calculate information gain given a dataset, column to split on, and target.
    """
    # Calculate original entropy.
    original_entropy = calc_entropy(data[target_name])

    # Find the median of the column we're splitting.
    column = data[split_name]
    median = column.median()

    # Make two subsets of the data based on the median.
    left_split = data[column <= median]
    right_split = data[column > median]

    # Loop through the splits, and calculate the subset entropy.
    to_subtract = 0
    for subset in [left_split, right_split]:
        prob = (subset.shape[0] / data.shape[0])
        to_subtract += prob * calc_entropy(subset[target_name])

    # Return information gain.
    return original_entropy - to_subtract

# Verify that our answer is the same as in the last screen.
print(calc_information_gain(income, "age", "high_income"))
'''
0.0470286613047
'''

columns = ["age", "workclass", "education_num", "marital_status", "occupation", "relationship", "race", "sex", "hours_per_week", "native_country"]
information_gains = []
# Loop through and compute information gains.
for col in columns:
    information_gain = calc_information_gain(income, col, "high_income")
    information_gains.append(information_gain)

# Find the name of the column with the highest gain.
highest_gain_index = information_gains.index(max(information_gains))
highest_gain = columns[highest_gain_index]
'''
highest_gain_index : 3
highest_gain : 'marital_status'
'''
ID3 Algorithm
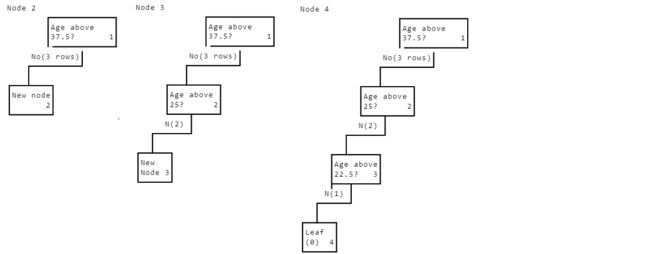
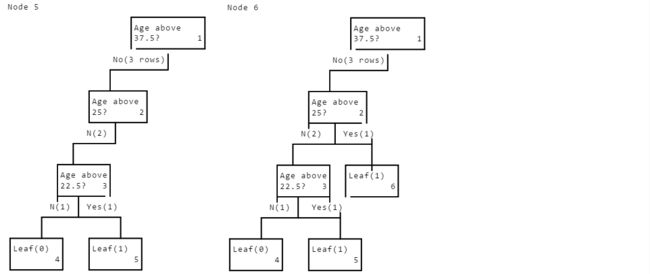
- ID3算法涉及到递归,下面是递归ID3算法的伪代码:

- 为了简化算法,方便演示,下面的代码修改了下这个伪代码,我们的决策树每个节点只产生两个分支。迭代的过程简画如下:
Column Split Selection
- 前面已经写出了计算熵的函数calc_entropy以及计算信息增益的函数calc_information_gain,现在还需要一个函数find_best_column,能返回这个分裂的属性。
columns = ["age", "workclass", "education_num", "marital_status", "occupation", "relationship", "race", "sex", "hours_per_week", "native_country"]
def find_best_column(data, target_name, columns):
    information_gains = []
    # Loop through and compute information gains.
    for col in columns:
        information_gain = calc_information_gain(data, col, "high_income")
        information_gains.append(information_gain)

    # Find the name of the column with the highest gain.
    highest_gain_index = information_gains.index(max(information_gains))
    highest_gain = columns[highest_gain_index]
    return highest_gain

income_split = find_best_column(income, "high_income", columns)
Creating A Simple Recursive Algorithm
label_1s = []
label_0s = []

def id3(data, target, columns):
    unique_targets = pandas.unique(data[target])

    if len(unique_targets) == 1:
        if 0 in unique_targets:
            label_0s.append(0)
        elif 1 in unique_targets:
            label_1s.append(1)
        return

    # Find the best column to split on in our data.
    best_column = find_best_column(data, target, columns)
    # Find the median of the column.
    column_median = data[best_column].median()

    # Create the two splits.
    left_split = data[data[best_column] <= column_median]
    right_split = data[data[best_column] > column_median]

    # Loop through the splits and call id3 recursively.
    for split in [left_split, right_split]:
        # Call id3 recursively to process each branch.
        id3(split, target, columns)

# Create the dataset that we used in the example in the last screen.
data = pandas.DataFrame([
    [0,20,0],
    [0,60,2],
    [0,40,1],
    [1,25,1],
    [1,35,2],
    [1,55,1]
    ])
# Assign column names to the data.
data.columns = ["high_income", "age", "marital_status"]

# Call the function on our data to set the counters properly.
id3(data, "high_income", ["age", "marital_status"])- pandas.unique这个函数返回Series里的独一无二的值,比如Series值是[1,1,2,3,4,4,4],这个函数返回的是[1,2,3,4].当数据集中的target的独一无二的值为1时表示这个数据集都是同一类,因此,是叶子节点。
Storing The Tree
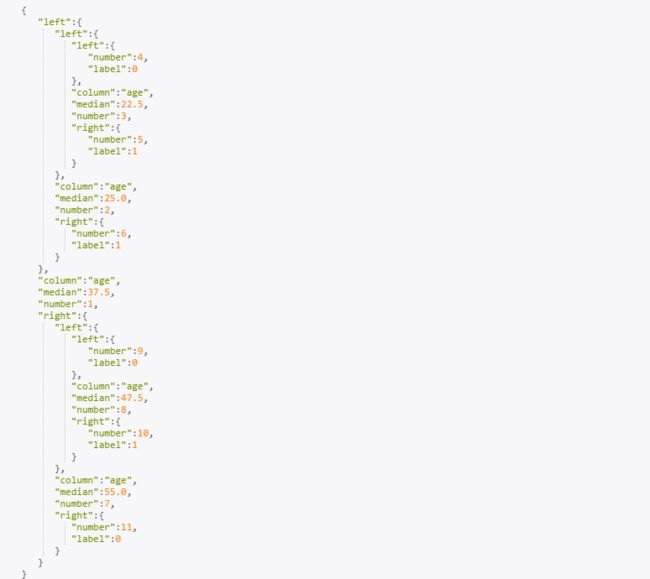
- 采用字典存储树,存储的方式如下,其中number表示这个node的id,发现树是一直向左支扩展,number递增的方向是根左右,前序遍历。
- 对于每个节点,标识其id为number。标记其分裂属性column,标记属性的中值median,其左右分支又是一个node(字典格式,嵌套的字典)。叶子节点还有一个属性label标识其类别。
# Create a dictionary to hold the tree.  This has to be outside the function so we can access it later.
tree = {}

# This list will let us number the nodes.  It has to be a list so we can access it inside the function.
nodes = []

def id3(data, target, columns, tree):
    unique_targets = pandas.unique(data[target])
    # 存储树的节点个数
    nodes.append(len(nodes) + 1)
    # 存储当前node的number:去nodes列表的最后一个元素[1,2...]
    tree["number"] = nodes[-1]

    if len(unique_targets) == 1:
        if 0 in unique_targets:
            tree["label"] = 0
        elif 1 in unique_targets:
            tree["label"] = 1
        return

    best_column = find_best_column(data, target, columns)
    column_median = data[best_column].median()

    tree["column"] = best_column
    tree["median"] = column_median

    left_split = data[data[best_column] <= column_median]
    right_split = data[data[best_column] > column_median]
    split_dict = [["left", left_split], ["right", right_split]]

    for name, split in split_dict:
        tree[name] = {}
        id3(split, target, columns, tree[name])

id3(data, "high_income", ["age", "marital_status"], tree)
A Prettier Tree
- 用字典存储树实在是看不清楚,因此打印出来。当我们遍历到一个node它有label键,表示这是个叶子节点,需要打印它的类别。并且需要记录遍历的深度,这样对于不同深度的节点打印时需要的空格也不同。
- 伪代码如下:

def print_with_depth(string, depth):
    # Add space before a string.
    prefix = "    " * depth
    # Print a string, appropriately indented.
    print("{0}{1}".format(prefix, string))


def print_node(tree, depth):
    # Check for the presence of label in the tree.
    if "label" in tree:
        # If there's a label, then this is a leaf, so print it and return.
        print_with_depth("Leaf: Label {0}".format(tree["label"]), depth)
        # This is critical -- without it, you'll get infinite recursion.
        return
    # Print information about what the node is splitting on.
    print_with_depth("{0} > {1}".format(tree["column"], tree["median"]), depth)

    for branch in [tree["left"], tree["right"]]:
        print_node(branch, depth+1)
print_node(tree, 0)
'''
age > 37.5
    age > 25.0
        age > 22.5
            Leaf: Label 0
            Leaf: Label 1
        Leaf: Label 1
    age > 55.0
        age > 47.5
            Leaf: Label 0
            Leaf: Label 1
        Leaf: Label 0
'''
Automatic Predictions
预测也是以迭代的形式遍历这棵树,下面是伪代码:

def predict(tree, row):
    if "label" in tree:
        return tree["label"]

    column = tree["column"]
    median = tree["median"]
    if row[column] <= median:
        return predict(tree["left"], row)
    else:
        return predict(tree["right"], row)

print(predict(tree, data.iloc[0]))
'''
0
'''
Making Multiple Predictions
new_data = pandas.DataFrame([
    [40,0],
    [20,2],
    [80,1],
    [15,1],
    [27,2],
    [38,1]
    ])
# Assign column names to the data.
new_data.columns = ["age", "marital_status"]
def batch_predict(tree, df):
    return df.apply(lambda x: predict(tree, x), axis=1)
predictions = batch_predict(tree, new_data)
'''
predictions
Series ()
0    0
1    0
2    0
3    0
4    1
5    0
dtype: int64
'''