skimage.measure.label和skimage.measure.regionprops()
原博客
https://www.cnblogs.com/denny402/p/5166258.html
skimage.measure.label()函数
对二值图像进行连通区域进行标记,它的返回值就是标记,并没有对二值图像进行改变
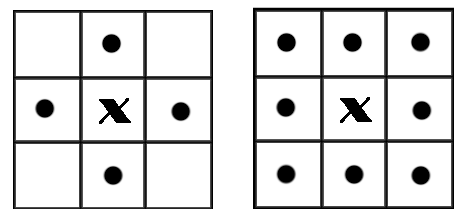
在二值图像中,如果两个像素点相邻且值相同(同为0或同为1),那么就认为这两个像素点在一个相互连通的区域内。而同一个连通区域的所有像素点,都用同一个数值来进行标记,这个过程就叫连通区域标记。在判断两个像素是否相邻时,我们通常采用4连通或8连通判断。在图像中,最小的单位是像素,每个像素周围有8个邻接像素,常见的邻接关系有2种:4邻接与8邻接。4邻接一共4个点,即上下左右,如下左图所示。8邻接的点一共有8个,包括了对角线位置的点,如下右图所示。
在skimage包中,我们采用measure子模块下的label()函数来实现连通区域标记。
函数格式:
skimage.measure.label(image,connectivity=None)
参数中的image表示需要处理的二值图像,connectivity表示连接的模式,1代表4邻接,2代表8邻接。
输出一个标记数组(labels), 从0开始标记。
#coding=utf-8
import numpy as np
import scipy.ndimage as ndi
from skimage import measure,color
import matplotlib.pyplot as plt

#编写一个函数来生成原始二值图像
def microstructure(l=256):
    n = 5
    x, y = np.ogrid[0:l, 0:l]  #生成网络
    mask = np.zeros((l, l))
    generator = np.random.RandomState(1)  #随机数种子
    points = l * generator.rand(2, n**2)
    mask[(points[0]).astype(np.int), (points[1]).astype(np.int)] = 1
    mask = ndi.gaussian_filter(mask, sigma=l/(4.*n)) #高斯滤波
    return mask > mask.mean()

data = microstructure(l=128)*1 #生成测试图片

labels=measure.label(data,connectivity=2)  #8连通区域标记
dst=color.label2rgb(labels)  #根据不同的标记显示不同的颜色
print('regions number:',labels.max()+1)  #显示连通区域块数(从0开始标记)

fig, (ax1, ax2) = plt.subplots(1, 2, figsize=(8, 4))
ax1.imshow(data, plt.cm.gray, interpolation='nearest')
ax1.axis('off')
ax2.imshow(dst,interpolation='nearest')
ax2.axis('off')

fig.tight_layout()
plt.show()
skimage.measure.regionprops()函数
如果想分别上面的的每一个连通区域进行操作,比如计算面积、外接矩形、凸包面积等,则需要调用measure子模块的regionprops()函数。该函数格式为:
返回所有连通区块的属性列表,常用的属性列表如下表:
| 属性名称 | 类型 | 描述 |
| area | int | 区域内像素点总数 |
| bbox | tuple | 边界外接框(min_row, min_col, max_row, max_col) |
| centroid | array | 质心坐标 |
| convex_area | int | 凸包内像素点总数 |
| convex_image | ndarray | 和边界外接框同大小的凸包 |
| coords | ndarray | 区域内像素点坐标 |
| Eccentricity | float | 离心率 |
| equivalent_diameter | float | 和区域面积相同的圆的直径 |
| euler_number | int | 区域欧拉数 |
| extent | float | 区域面积和边界外接框面积的比率 |
| filled_area | int | 区域和外接框之间填充的像素点总数 |
| perimeter | float | 区域周长 |
| label | int | 区域标记 |
代码
#coding=utf-8
import numpy as np
import scipy.ndimage as ndi
from skimage import measure,color
import matplotlib.pyplot as plt

#编写一个函数来生成原始二值图像
def microstructure(l=256):
    n = 5
    x, y = np.ogrid[0:l, 0:l]  #生成网络
    mask = np.zeros((l, l))
    generator = np.random.RandomState(1)  #随机数种子
    points = l * generator.rand(2, n**2)
    mask[(points[0]).astype(np.int), (points[1]).astype(np.int)] = 1
    mask = ndi.gaussian_filter(mask, sigma=l/(4.*n)) #高斯滤波
    return mask > mask.mean()

data = microstructure(l=128)*1 #生成测试图片

labels = measure.label(data,connectivity=2)  #

#筛选连通区域大于500的
properties = measure.regionprops(labels)
valid_label = set()
for prop in properties:
    if prop.area > 500:
        valid_label.add(prop.label)
current_bw = np.in1d(labels, list(valid_label)).reshape(labels.shape)


dst = color.label2rgb(current_bw)  #根据不同的标记显示不同的颜色
print('regions number:', current_bw.max()+1)  #显示连通区域块数(从0开始标记)

fig, (ax1, ax2, ax3) = plt.subplots(1, 3, figsize=(8, 4))
ax1.imshow(data, plt.cm.gray, interpolation='nearest')
ax1.axis('off')
ax2.imshow(current_bw, plt.cm.gray, interpolation='nearest')
ax2.axis('off')
ax3.imshow(dst,interpolation='nearest')
ax3.axis('off')

fig.tight_layout()
plt.show()
skimage.segmentation.clear_border函数
https://blog.csdn.net/qq_36401512/article/details/88252649
clear_border(labels, buffer_size=0, bgval=0, in_place=False)主要作用是清除二值图像中边界的1值。例如
>>> import numpy as np
>>> from skimage.segmentation import clear_border
>>> labels = np.array([[0, 0, 0, 0, 0, 0, 0, 1, 0],
...                    [0, 0, 0, 0, 1, 0, 0, 0, 0],
...                    [1, 0, 0, 1, 0, 1, 0, 0, 0],
...                    [0, 0, 1, 1, 1, 1, 1, 0, 0],
...                    [0, 1, 1, 1, 1, 1, 1, 1, 0],
...                    [0, 0, 0, 0, 0, 0, 0, 0, 0]])
>>> clear_border(labels)
array([[0, 0, 0, 0, 0, 0, 0, 0, 0],
       [0, 0, 0, 0, 1, 0, 0, 0, 0],
       [0, 0, 0, 1, 0, 1, 0, 0, 0],
       [0, 0, 1, 1, 1, 1, 1, 0, 0],
       [0, 1, 1, 1, 1, 1, 1, 1, 0],
       [0, 0, 0, 0, 0, 0, 0, 0, 0]])


