opencv-python阈值分割
全局阈值分割`
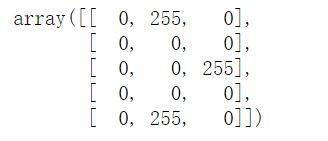
import numpy as np
src = np.array([[123,234,68],[33,51,17],[48,98,234],[129,89,27],[45,167,134]])
src[src>150] = 255
src[src<=150] = 0
src
在图像处理中一般不处理原图 而是使用ndarray的成员函数copy()
阈值函数
threshold(InputArray src, OutputArray dst, double thresh, double maxval, int type )
src 单通道矩阵
dst 输出矩阵
thresh 阈值
maxval 图像二值化显示时 一般设置为255
type 类型
类型:
-
type = THRESH_BINARY
值大于阈值时 把值变成maxval的值
-
type = THRESH_BINARY_INV
值小于等于阈值时 把值变成maxval的值
-
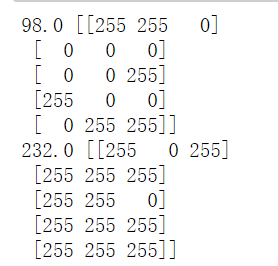
当类型为THRESH_OTSU和THRESH_TRIANGLE时 src只支持uchar类型 这是thresh也可以作为输出参数,即通过otsu和triangle 这两种算法自动计算出。一般这两种方法和THRESH_BINARY搭配使用。
import cv2
src = np.array([[123,234,68],[33,51,17],[48,98,234],[129,89,27],[45,167,134]],np.uint8)
#手动设置阈值
the = 150
maxval = 255
dst = cv2.threshold(src,the,maxval,cv2.THRESH_BINARY)
#Otsu阈值处理
otsuThe = 0
otsuThe, dst_Otsu = cv2.threshold(src,otsuThe,maxval,cv2.THRESH_OTSU)
print(otsuThe, dst_Otsu)

#TRIANGLE 阈值处理
triThe = 0
triThe, dst_tri = cv2.threshold(src,triThe,maxval,cv2.THRESH_TRIANGLE+cv2.THRESH_BINARY_INV)
print(triThe, dst_tri)
局部阈值分割
在理想情况下使用全局阈值是比较合理的,但是往往由于图像光照不均匀的等因素,
全局阈值的效果是不理想的。
在这种情况下,使用局部阈值(也叫自适应阈值)进行分割可以产生好的效果。
局部阈值分割的核心也是计算阈值矩阵,比较常用的是后面提到的自适应阈值算法
(又称移动平均值算法),是一种简单但是高效的局部阈值算法,
其核心思想就是把每一个像素的邻域的平均值作为该位置的阈值
- 直方图技术法
一幅含有一个背景呈现明显对比的物体的图像具有包含双峰的直方图,直方图技术法就是首先找到这两个峰值,然后取两个峰值之间的波谷位置对应的灰度值,就是所要的阈值。遗憾的是由于灰度在直方图中的随机波动,两个波峰(局部最大值)和它们之间的波谷都不能很好的确定,比如在两个峰值之间很可能会出现两个最小值,所以希望通过鲁棒的方法选定与最小值对应的阈值。一种常用的方法就是先对直方图进行高斯平滑处理,逐渐增大高斯滤波器的标准差, 直到能从平滑后的直方图中得到两个唯一的波峰和它们之间唯一的最小值。但这种方式需要手动调节,下面介绍一种规则自动选取波峰和波谷的方式。
假设输入图像为I,高为H,宽为W,histogram_I代表其对应的灰度直方图,histogram_I_k代表灰度值等于k的像素点的个数,其中0<= k <=255
-
第一步:
找到灰度直方图的第一个峰值,并找到其对应的灰度值,记为firstPeak -
第二步:
找到直方图的第二个峰值,并找到其对应的灰度值。第二个峰值不一定是直方图的第二大值,因为它很有可能会出现第一峰值的附近。可以用公式计算:
secondPeak = argmax{(k-firstPeak)^2 * histogram_I_k}, 0< =k <=255
也可以使用绝对值的形式:
secondPeak = argmax{|k-firstPeak|*histogram_I_k}, 0< =k <=255
- 第三步:
找到这两个峰值之间的波谷,如果出现两个或多个波谷,则取左侧的波谷即可, 其对应的灰度值即为阈值
#python实现
#在利用直方图技术计算阈值时, 会计算一个直方图最大值的位置索引,
#可利用Numpy提供的where函数,该函数的示例代码如下:

import numpy as np
hist = np.array([10,3,13,2,1,5])
maxLoc = np.where(hist==np.max(hist))
maxLoc
#如果出现多个最大值的情况
import numpy as np
hist = np.array([10,3,13,2,13,1,5])
maxLoc = np.where(hist==np.max(hist))
maxLoc
#对于一维数组 如果出现多个最大值 则返回为存储所有最大值索引的以为数组组成的元组
def calcGrayHist(I):
    #计算灰度直方图
    h, w = I.shape[:2]
    grayHist = np.zeros([256], np.uint64)
    for i in range(h):
        for j in range(w):
            grayHist[I[i][j]] += 1
    return grayHist
def threshTwoPeaks(image):
    #计算灰度直方图
    histogram = calcGrayHist(image)
    #找到灰度直方图的最大值对应的灰度值
    maxLoc = np.where(histogram==np.max(histogram))
    firstPeak = maxLoc[0][0]
    #寻找灰度直方图的第二个峰值对应的灰度值
    measureDists = np.zeros([256], np.float32)
    for k in range(256):
        measureDists[k] = pow(k-firstPeak,2)*histogram[k]
    maxLoc2 = np.where(measureDists==np.max(measureDists))
    secondPeak = maxLoc2[0][0]
    #找到两个峰值之间的最小值对应的灰度值,作为阈值
    thresh = 0
    if firstPeak > secondPeak:#第一个峰值在第二个峰值的右侧
        temp = histogram[int(secondPeak):int(firstPeak)]
        minLoc = np.where(temp == np.min(temp))
        thresh = secondPeak + minLoc[0][0]+1
    else:#第一个峰值在第二个峰值的左侧
        temp = histogram[int(firstPeak):int(secondPeak)]
        minLoc = np.where(temp == np.min(temp))
        thresh = secondPeak + minLoc[0][0]+1
    #找到阈值后进行阈值处理 得到二值图
    threshImage_out = image.copy()
    threshImage_out[threshImage_out > thresh] = 255
    threshImage_out[threshImage_out < thresh] = 0
    return (thresh, threshImage_out)
import cv2
import numpy as np
import matplotlib.pyplot as plt

img = cv2.imread('cat.jpg',0)
thresh, img_dst = threshTwoPeaks(img)
print('thresh is :',thresh)

plt.figure(figsize=(20,20)) #设置窗口大小
img_dog = cv2.cvtColor(img, cv2.COLOR_BGR2RGB)
plt.subplot(1,1,1), plt.title('b')
plt.imshow(img_dog), plt.axis('off')

plt.figure(figsize=(20,20)) #设置窗口大小
dst_img = cv2.cvtColor(img_dst, cv2.COLOR_BGR2RGB)
plt.subplot(1,1,1), plt.title('b')
plt.imshow(dst_img), plt.axis('off')
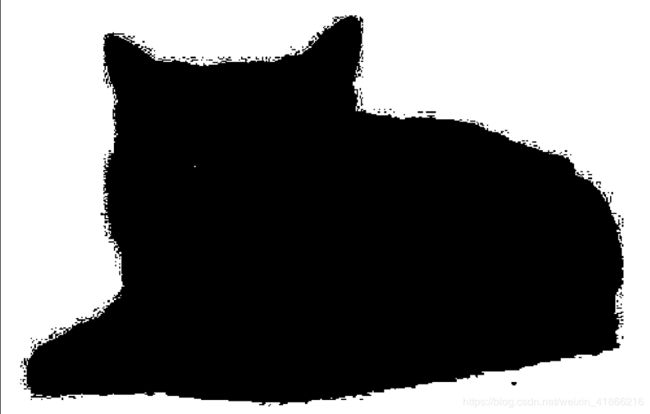
thresh is : 173

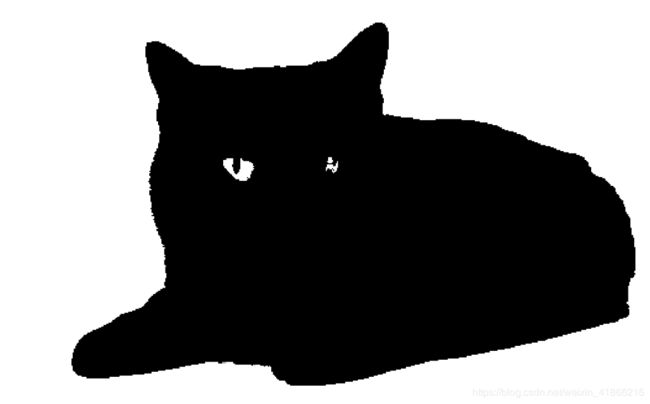
在直方图中存在明显双峰的情况下,使用基于直方图计算得到的阈值效果很好,比较完整地分割出图中目标物体;
否则使用这种方法分割后的效果并不理想,没有完整地分割出前景和背景,几乎分辨不清目标物体。
- 熵算法(公式复杂不会手敲)
信息熵的概念来源于信息论,假设信源符号u有N种取值,记为:
u1,u2,…,uN。
且每一种信源符号出现的概率,记为:
p1,p2,…,pN
那个该信号源的信息熵记为:
entropy(u)= - sum(p_i*log(p_i)) 1<=i<=N
图像也可以看作一种信源,假设输入图像为I,normHist_I代表归一化的图像灰度直方图,那么对于8位图可以看成有256个灰度符号,且每一个符号出现的概率为normHist_I(k)组成的信源, 其中0<=k<=255
#采用熵算法进行阈值分割的python实现
#首先将计算得出的累加概率直方图和各个灰度级的熵分别保存到长度为256的ndarray种。
#需要注意的是,在第二步的实现中,因为对数的自变量是不能等于0的,如果判断normHist_I(k)=0,
#那么直接令entropy(k)=entropy(k-1)即可
def threshEntroy(image):
    rows, cols = image.shape
    #求灰度直方图
    grayHist = calcGrayHist(image)
    #归一化灰度直方图 即概率直方图
    normGrayHist = grayHist/float(rows*cols)
    #第一步:计算累加直方图,也称零阶累计矩
    zeroCumuMoment = np.zeros([256], np.float32)
    for k in range(256):
        if k == 0:
            zeroCumuMoment[k] = normGrayHist[k]
        else:
            zeroCumuMoment[k] = zeroCumuMoment[k-1] + normGrayHist[k]
    #第二步: 计算各个灰度级的熵
    entropy = np.zeros([256], np.float32)
    for k in range(256):
        if k == 0:
            if normGrayHist[k] == 0:
                entropy[k] = 0
            else:
                entropy[k] = -normGrayHist[k]*math.log10(normGrayHist[k])
        else:
            if normGrayHist[k] == 0:
                entropy[k] = entropy[k-1]
            else:
                entropy[k] = entropy[k-1]-normGrayHist[k]*math.log10(normGrayHist[k])
    #第三步:找阈值
    fT = np.zeros([256], np.float32)
    ft1,ft2 = 0.0,0.0
    totalEntroy = entropy[255]
    for k in range(255):
        #找最大值
        maxFront = np.max(normGrayHist[0:k+1])
        maxBack = np.max(normGrayHist[k+1:256])
        if(maxFront == 0 or zeroCumuMoment[k] == 0 or maxFront == 1 or
          zeroCumuMoment[k] == 1 or totalEntroy == 0):
            ft1 = 0
        else:
            ft1 = entropy[k]/totalEntroy*(math.log10(zeroCumuMoment[k])/math.log10(maxFront))
        if(maxBack == 0 or 1-zeroCumuMoment[k] == 0 or maxBack == 1 or 1-zeroCumuMoment[k] == 1):
            ft2 = 0
        else:
            ft2 = (1-entropy[k]/totalEntroy)*(math.log10(1-zeroCumuMoment[k])/math.log10(maxBack))
        fT[k] = ft1+ft2
        #找出最大值的索引, 作为得到的阈值
        threshLoc = np.where(fT==np.max(fT))
        thresh = threshLoc[0][0]
        #阈值处理
        threshold = np.copy(image)
        threshold[threshold > thresh] = 255
        threshold[threshold <= thresh] = 0
        return threshold
import math
img_ft = threshEntroy(img)
plt.figure(figsize=(20,20)) #设置窗口大小
img_ft = cv2.cvtColor(img_ft, cv2.COLOR_BGR2RGB)
plt.subplot(1,1,1), plt.title('b')
plt.imshow(img_ft), plt.axis('off')
从图中可以看出,所得到的效果并没有采用直方图技术进行阈值分割得到的效果有明显的提升,所以针对阈值分割选取什么样的方法需要分情况对待
敲了这么多效果不好:淦
- Otsu阈值处理
在对图像进行阈值分割时,所选取的分割阈值应使前景区域的平均灰度,背景区域的平均灰度与整幅图像的平均灰度之间差异最大,这种差异用区域的方差来表示。
Otsu提出了最大方差法,该算法是在判别分析最小二乘法原理的基础上推导出来的,计算过程简单是一种常用的阈值分割的稳定算法。
- 第一步:计算灰度直方图的零阶累积矩(或称累加直方图)。
- 第二步:计算灰度直方图的一阶累积矩
- 第三步:计算图像总体的灰度平均值mean, 其实就是k = 255时时的一阶累积矩
- 第四步:计算每一个灰度级作为阈值时, 前景区域的平均灰度, 背景区域的平均灰度 与整幅图像的平混灰度的方差。
- 第五步: 找到上述最大的方差 然后独赢的k 即为Otsu 自动选取的阈值
#实现Ostu阈值分割
#输入参数为8位图 返回值为由阈值分割结果和Ostu阈值组成的二元元组
#注意 在求方差时 分母有可能出现0的情况
def otsu(image):
    rows, cols = image.shape
    #计算图像的灰度直方图
    grayHist = calcGrayHist(image)
    #归一化灰度直方图
    uniformGrayHist = grayHist/float(rows*cols)
    #计算零阶累积矩和一阶累积矩
    zeroCumuMoment = np.zeros([256], np.float32)
    oneCumuMoment = np.zeros([256], np.float32)
    for k in range(256):
        if k == 0:
            zeroCumuMoment[k] = uniformGrayHist[0]
            oneCumuMoment[k] = k*uniformGrayHist[0]
        else:
            zeroCumuMoment[k] = zeroCumuMoment[k-1] + uniformGrayHist[k]
            oneCumuMoment[k] = zeroCumuMoment[k-1] + k*uniformGrayHist[k]
    #计算类间方差
    variance = np.zeros([256], np.float32)
    for k in range(255):
        if zeroCumuMoment[k] == 0 or zeroCumuMoment[k] == 1:
            variance[k] = 0
        else:
            variance[k] = math.pow(oneCumuMoment[255]*zeroCumuMoment[k] - oneCumuMoment[k],2)/(zeroCumuMoment[k]*(1.0-zeroCumuMoment[k]))
    #找到阈值
    threshLoc = np.where(variance[0:255] == np.max(variance[0:255]))
    thresh = threshLoc[0][0]
    #阈值处理
    threshold = np.copy(image)
    threshold[threshold > thresh] = 255
    threshold[threshold <= thresh] = 0
    return (threshold,thresh)
img_otsu, thresh = otsu(img)
print("thresh is:", thresh)
plt.figure(figsize=(20,20)) #设置窗口大小
img_otsu = cv2.cvtColor(img_otsu, cv2.COLOR_BGR2RGB)
plt.subplot(1,1,1), plt.title('b')
plt.imshow(img_otsu), plt.axis('off')
thresh is: 251
- 自适应阈值
在不均匀照明或者灰度值分布不均匀的情况下 如果使用全局阈值分割那么得到的分割效果往往会很不理想 。
def adaptiveThresh(I, winSize, ratio=0.12):
    #第一步 对图像进行均值平滑
    I_mean = cv2.boxFilter(I, cv2.CV_32FC1, winSize)
    #第二步 原图像矩阵与平滑结果做差
    out = I - (1.0-ratio)*I_mean
    #第三步 当差值大于等于 0 时, 输出值为255;反之 输出为0
    out[out>=0] = 255
    out[out<0] = 0
    out = out.astype(np.uint8)
    return out

dst_adap = adaptiveThresh(img, (35,35))
plt.figure(figsize=(20,20)) #设置窗口大小
dst_adap = cv2.cvtColor(dst_adap, cv2.COLOR_BGR2RGB)
plt.subplot(1,1,1), plt.title('b')
plt.imshow(dst_adap), plt.axis('off')
