激活函数及其导函数图像
import matplotlib.pyplot as plt
import numpy as np
plt.rcParams["font.family"] = "SimHei"
plt.rcParams['axes.unicode_minus'] = False
sigmoid 函数
x=np.linspace(-10,10,100)
y=1/(1+np.exp(-x))
plt.xlabel("x")
plt.ylabel("y")
plt.title("sigmoid function and its derivative image")
plt.plot(x,y,color='r',label="sigmoid")
y=np.exp(-x)/pow((1+np.exp(-x)),2)
plt.plot(x,y,color='b',label="derivative")
plt.legend()
plt.show()
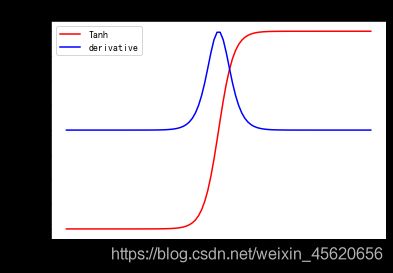
tanh函数
x=np.linspace(-10,10,100)
y=(1-np.exp(-2*x))/(1+np.exp(-2*x))
plt.xlabel('x')
plt.ylabel('y')
plt.title("Tanh function and its derivative image")
plt.plot(x,y,color='r',label='Tanh')
y=1-pow((1-np.exp(-2*x))/(1+np.exp(-2*x)),2)
plt.plot(x,y,color='b',label='derivative')
plt.legend()
plt.show()
Relu 函数 (分段函数的绘图)
x=np.linspace(-2,2,100)
y=x*(x>0)
plt.xlabel('x')
plt.ylabel('y')
plt.title("Relu function")
plt.plot(x,y,color='r',label="Relu")
plt.legend()
x=np.linspace(-2,0)
y=np.linspace(0,0)
plt.plot(x,y,color='b')

plt.vlines(0, 0, 1, colors = "b")

x=np.linspace(0,2)
y=np.linspace(1,1)
plt.title("Relu's derivative image")
plt.plot(x,y,color='b',label="derivative")

plt.legend()
plt.show()
绘制横竖线段
可以使用:
vlines(x, ymin, ymax)
hlines(y, xmin, xmax)
画竖横线段
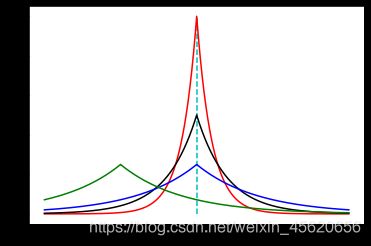
def Laplacian_Prior(x, u, b):
    return 1.0/(2*b)*np.exp(-abs(x - u)/b)

if __name__ == "__main__":
    x = np.arange(-10, 10, 0.01)
    y_1 = Laplacian_Prior(x, 0, 1)
    y_2 = Laplacian_Prior(x, 0, 2)
    y_3 = Laplacian_Prior(x, 0, 4)
    y_4 = Laplacian_Prior(x, -5, 4)
    plt.plot(x, y_1, "r-")
    plt.plot(x, y_2, "k-")
    plt.plot(x, y_3, "b-")
    plt.plot(x, y_4, "g-")
    plt.vlines(0, 0, 0.5, colors = "c", linestyles = "dashed")


