vue-table-with-tree-grid文档及用法
文档:
API
Table Attributes
| 属性 | 说明 | 类型 | 参数 | 默认值 |
|---|---|---|---|---|
| data | 表格各行的数据 | Array | - | [] |
| mpty-text | 表格数据为空时显示的文字 | String | - | ‘暂无数据’ |
| columns | 表格各列的配置(具体见下文:Columns Configs) | Array | - | [] |
| show-header | 是否显示表头 | Boolean | - | true |
| show-index | 是否显示数据索引 | Boolean | - | false |
| index-text | 数据索引名称 | String | - | ‘序号’ |
| show-summary | 是否显示表尾合计行 | Boolean | - | false |
| sum-text | 表尾合计行首列名称 | String | - | ‘合计’ |
| summary-method | 表尾合计行计算方法 | Function | data, column, columnIndex | - |
| max-height | 最大高度 | [String, Number] | - | ‘auto’ |
| stripe | 是否显示间隔斑马纹 | Boolean | - | false |
| border | 是否显示纵向边框 | Boolean | - | false |
| show-row-hover | 鼠标悬停时,是否高亮当前行 | Boolean | - | true |
| tree-type | 是否为树形表格 | Boolean | - | false |
| children-prop | 树形表格中遍历的属性名称 | String | - | ‘children’ |
| is-fold | 树形表格中父级是否默认折叠 | Boolean | - | true |
| expand-type | 是否为展开行类型表格(为 True 时,需要添加名称为 ‘$expand’ 的作用域插槽, 它可以获取到 row, rowIndex) | Boolean | - | false |
| selection-type | 是否为多选类型表格 Boolean - false | |||
| row-key | 行数据的 | Key,用来优化 Table 的渲染 | Function row, rowIndex rowIndex | |
| row-class-name | 额外的表格行的类名 | String, Function | row, rowIndex | - |
| cell-class-name | 额外的表格行的类名 | String, Function | row, rowIndex, column, columnIndex | - |
| row-style | 额外的表格行的样式 | Object, Function | row, rowIndex | - |
| cell-style | 额外的表格单元格的样式 | Object, Function | row, rowIndex, column, columnIndex | - |
Columns Configs
| 属性 | 说明 | 类型 | 默认值 |
|---|---|---|---|
| label | 列标题名称 | String | ‘’ |
| prop | 对应列内容的属性名 | String | ‘’ |
| align | 对应列内容的对齐方式,可选值有 ‘center’, ‘right’ | String | ‘left’ |
| headerAlign | 对应列标题的对齐方式,可选值有 ‘center’, ‘right’ | String | ‘left’ |
| width | 列宽度 | [String, Number] | ‘auto’ |
| minWidth | 列最小宽度 | [String, Number] | ‘80px’ |
| type | 列类型,可选值有 ‘template’(自定义列模板) | String | ‘’ |
| template | 列类型为 ‘template’(自定义列模板) 时,对应的作用域插槽(它可以获取到 row, rowIndex, column, columnIndex)名称 | String | ‘’ |
Table Events
| 事件名 | 说明 | 参数 |
|---|---|---|
| cell-click | 单击某一单元格 | row, rowIndex, column, columnIndex, $event |
| cell-dblclick | 双击某一单元格 | row, rowIndex, column, columnIndex, $event |
| cell-contextmenu | 在某一单元格上点击鼠标右键 | row, rowIndex, column, columnIndex, $event |
| cell-mouseenter | 鼠标滑入某一单元格 | row, rowIndex, column, columnIndex, $event |
| cell-mouseleave | 鼠标滑出某一单元格 | row, rowIndex, column, columnIndex, $event |
| row-click | 单击某一行 | row, rowIndex, $event |
| row-dblclick | 双击某一行 | row, rowIndex, $event |
| row-contextmenu | 在某一行上点击鼠标右键 | row, rowIndex, $event |
| row-mouseenter | 鼠标滑入某一行 | row, rowIndex, $event |
| row-mouseleave | 鼠标滑出某一行 | row, rowIndex, $event |
| checkbox-click | 鼠标单击checkbox | row, rowIndex, $event |
| tree-icon-click | 鼠标单击树形icon | row, rowIndex, $event |
| expand-cell-click | 鼠标单击展开单元格 | row, rowIndex, $event |
Table Methods
| 方法名 | 说明 | 参数 |
|---|---|---|
| getCheckedProp | 当表格为多选类型表格时,用于获取当前所选项的属性,返回一个数组;属性默认为’index’。 | prop |
Keywords
vue vue-table tree-grid vue-component vue-jsx
用法:
平时我们用element-ui组件库的时候,用的很多组件都可以解决日常工作中的需要,最近遇到了一个需要搭建一个树形结构的表格,但element组件没有提供,这时就需要自己去通过第三方组件来实现这个功能了。
那么如何才能实现这样的结构方式呢?就需要通过vue-table-with-tree-grid这个组件了
一、在vue脚手架的依赖项的开发依赖,搜索并安装vue-table-with-tree-grid这个
二、在你的项目的main.js文件中引入,如图:
三、这时就可以使用这个treetable标签来搭建表格了,也可以打开github上相应的文档进行查看属性,但github国内限速的原因,打开速度太慢,我就在这里列出几个常用的属性来供参考
官方示例:
<template lang="html">
  <div id="example">
    <ul class="switch-list">
      <li class="switch-item" v-for="item in propList">
        <span>{{ item.name }}: </span>
        <zk-switch v-model="props[item.name]"></zk-switch>
      </li>
    </ul>
    <zk-table
      ref="table"
      sum-text="sum"
      index-text="#"
      :data="data"
      :columns="columns"
      :stripe="props.stripe"
      :border="props.border"
      :show-header="props.showHeader"
      :show-summary="props.showSummary"
      :show-row-hover="props.showRowHover"
      :show-index="props.showIndex"
      :tree-type="props.treeType"
      :is-fold="props.isFold"
      :expand-type="props.expandType"
      :selection-type="props.selectionType">
      <template slot="$expand" scope="scope">
        {{ `My name is ${scope.row.name},
           this rowIndex is ${scope.rowIndex}.`
         }}
      </template>
      <template slot="likes" scope="scope">
        {{ scope.row.likes.join(',') }}
      </template>
    </zk-table>
  </div>
</template>

<script>
  import ZkSwitch from './Switch/Switch';
  export default {
    name: 'example',
    components: {
      ZkSwitch,
    },
    data() {
      return {
        props: {
          stripe: false,
          border: false,
          showHeader: true,
          showSummary: false,
          showRowHover: true,
          showIndex: false,
          treeType: true,
          isFold: true,
          expandType: false,
          selectionType: false,
        },
        data: [
          {
            name: 'Jack',
            sex: 'male',
            likes: ['football', 'basketball'],
            score: 10,
            children: [
              {
                name: 'Ashley',
                sex: 'female',
                likes: ['football', 'basketball'],
                score: 20,
                children: [
                  {
                    name: 'Ashley',
                    sex: 'female',
                    likes: ['football', 'basketball'],
                    score: 20,
                  },
                  {
                    name: 'Taki',
                    sex: 'male',
                    likes: ['football', 'basketball'],
                    score: 10,
                    children: [
                      {
                        name: 'Ashley',
                        sex: 'female',
                        likes: ['football', 'basketball'],
                        score: 20,
                      },
                      {
                        name: 'Taki',
                        sex: 'male',
                        likes: ['football', 'basketball'],
                        score: 10,
                        children: [
                          {
                            name: 'Ashley',
                            sex: 'female',
                            likes: ['football', 'basketball'],
                            score: 20,
                          },
                          {
                            name: 'Taki',
                            sex: 'male',
                            likes: ['football', 'basketball'],
                            score: 10,
                          },
                        ],
                      },
                    ],
                  },
                ],
              },
              {
                name: 'Taki',
                sex: 'male',
                likes: ['football', 'basketball'],
                score: 10,
              },
            ],
          },
          {
            name: 'Tom',
            sex: 'male',
            likes: ['football', 'basketball'],
            score: 20,
            children: [
              {
                name: 'Ashley',
                sex: 'female',
                likes: ['football', 'basketball'],
                score: 20,
                children: [
                  {
                    name: 'Ashley',
                    sex: 'female',
                    likes: ['football', 'basketball'],
                    score: 20,
                  },
                  {
                    name: 'Taki',
                    sex: 'male',
                    likes: ['football', 'basketball'],
                    score: 10,
                  },
                ],
              },
              {
                name: 'Taki',
                sex: 'male',
                likes: ['football', 'basketball'],
                score: 10,
                children: [
                  {
                    name: 'Ashley',
                    sex: 'female',
                    likes: ['football', 'basketball'],
                    score: 20,
                  },
                  {
                    name: 'Taki',
                    sex: 'male',
                    likes: ['football', 'basketball'],
                    score: 10,
                  },
                ],
              },
            ],
          },
          {
            name: 'Tom',
            sex: 'male',
            likes: ['football', 'basketball'],
            score: 20,
          },
          {
            name: 'Tom',
            sex: 'male',
            likes: ['football', 'basketball'],
            score: 20,
            children: [
              {
                name: 'Ashley',
                sex: 'female',
                likes: ['football', 'basketball'],
                score: 20,
              },
              {
                name: 'Taki',
                sex: 'male',
                likes: ['football', 'basketball'],
                score: 10,
              },
            ],
          },
        ],
        columns: [
          {
            label: 'name',
            prop: 'name',
            width: '400px',
          },
          {
            label: 'sex',
            prop: 'sex',
            minWidth: '50px',
          },
          {
            label: 'score',
            prop: 'score',
          },
          {
            label: 'likes',
            prop: 'likes',
            minWidth: '200px',
            type: 'template',
            template: 'likes',
          },
        ],
      };
    },
    computed: {
      propList() {
        return Object.keys(this.props).map(item => ({
          name: item,
        }));
      },
    },
    methods: {
    },
  };
</script>

<style scoped lang="less">
  * {
    margin: 0;
    padding: 0;
  }
  .switch-list {
    margin: 20px 0;
    list-style: none;
    overflow: hidden;
  }
  .switch-item {
    margin: 20px;
    float: left;
  }
</style>
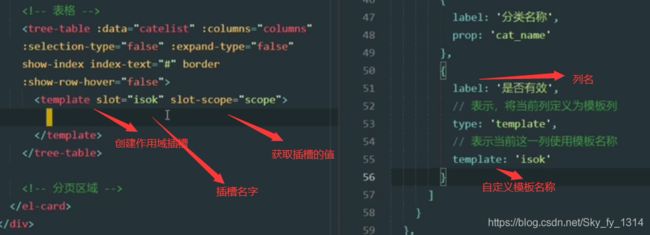
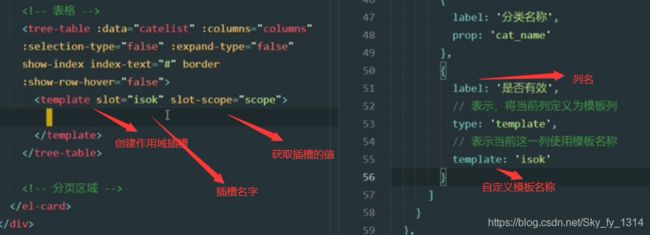
作用域插槽使用图解


图上共有七个属性,分别是绑定数据源、columns定义竖行的内容,它是一个数组,数组中的每个对象就代表一个竖行所要展示的内容,下面会说到它的一些参数、selection-type是否为多选类型的表格,默认值是true,如果不想要多选的框可以设置为false、expand-type展开行效果、show-index显示数据的索引值、index-text自定义索引名称,默认的是‘序号’两个字、border表格竖行分割线。
四、columns竖行内容
每一个数组都是一竖列的内容,label竖列标题、prop所绑定的属性、type将这一竖列自定义为模板列、template模板列的名称
这两个数组就代表前两竖列的内容
五、如果需要自定义模板插槽,就需要在columns定义一个如同第二个数组这样的数据,并通过在标签中用作用域插槽来实现
后面几竖列都是通过插入模板来实现的,和上面实现两个图标的步骤是一样的,就不再一一列举了


