02_Cutecharts 饼图、雷达图、散点图 (下)

文章目录
- Pie饼图
- 相关参数设置
- 基本示例
- Pie效果演示
- 非镂空饼图
- Radar(雷达图)
- 相关参数设置
- 基本示例
- 效果图演示
- Scatter(散点图)
- 相关参数设置
- 基本示例
- 效果图演示
Pie饼图
相关参数设置
Params                                          Desc
------                                          ----
labels: Iterable                                数据标签列表
inner_radius: float = 0.5                       Pie 图半径
legend_pos: str = "upLeft"                      图例位置,有 "upLeft", "upRight", "downLeft", "downRight" 可选
colors: Optional[Iterable] = None               label 颜色数组
font_family: Optional[str] = None               CSS font-family
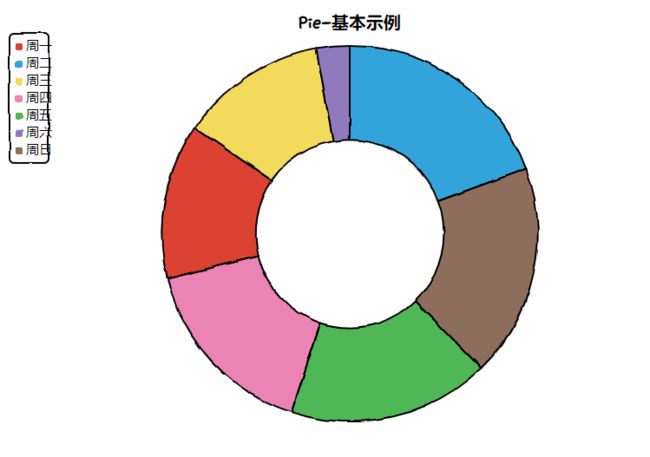
基本示例
from cutecharts.charts import Pie
from cutecharts.components import Page
from cutecharts.faker import Faker


def pie_base() -> Pie:
    chart = Pie("Pie-基本示例")
    chart.set_options(labels=Faker.choose())
    chart.add_series(Faker.values())
    return chart


pie_base().render()
Pie效果演示
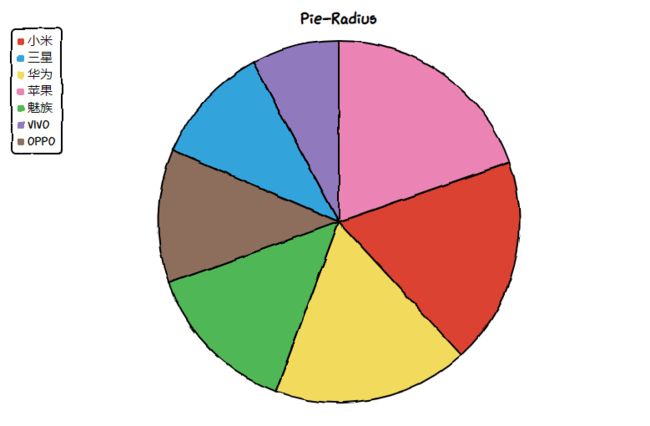
非镂空饼图
def pie_radius():
    chart = Pie("Pie-Radius")
    chart.set_options(
        labels=Faker.choose(),
        inner_radius=0,
    )
    chart.add_series(Faker.values())
    return chart
Radar(雷达图)
相关参数设置
Params                                          Desc
------                                          ----
labels: Iterable                                数据标签列表
is_show_label: bool = True                      是否显示标签
is_show_legend: bool = True                     是否显示图例
tick_count: int = 3                             坐标系分割刻度
legend_pos: str = "upLeft"                      图例位置,有 "upLeft", "upRight", "downLeft", "downRight" 可选
colors: Optional[Iterable] = None               label 颜色数组
font_family: Optional[str] = None               CSS font-family
基本示例
from cutecharts.charts import Radar
from cutecharts.components import Page
from cutecharts.faker import Faker


def radar_base() -> Radar:
    chart = Radar("Radar-基本示例")
    chart.set_options(labels=Faker.choose())
    chart.add_series("series-A", Faker.values())
    chart.add_series("series-B", Faker.values())
    return chart


radar_base().render()
效果图演示

Scatter(散点图)
相关参数设置
Params                                          Desc
------                                          ----
x_label: str = ""                               X 坐标轴名称
y_label: str = ""                               Y 坐标轴名称
x_tick_count: int = 3                           X 轴刻度分割段数
y_tick_count: int = 3                           Y 轴刻度分割段数
is_show_line: bool = False                      是否将散点连成线
dot_size: int = 1                               散点大小
time_format: Optional[str] = None               日期格式
legend_pos: str = "upLeft"                      图例位置,有 "upLeft", "upRight", "downLeft", "downRight" 可选
colors: Optional[Iterable] = None               label 颜色数组
font_family: Optional[str] = None               CSS font-family
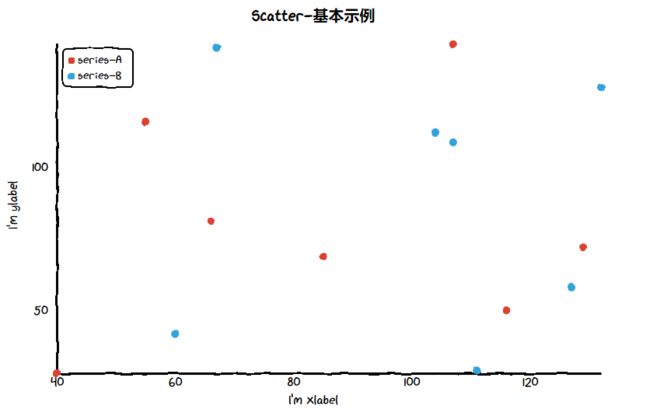
基本示例
from cutecharts.charts import Scatter
from cutecharts.components import Page
from cutecharts.faker import Faker


def scatter_base() -> Scatter:
    chart = Scatter("Scatter-基本示例")
    chart.set_options(x_label="I'm xlabel", y_label="I'm ylabel")
    chart.add_series(
        "series-A", [(z[0], z[1]) for z in zip(Faker.values(), Faker.values())]
    )
    chart.add_series(
        "series-B", [(z[0], z[1]) for z in zip(Faker.values(), Faker.values())]
    )
    return chart


scatter_base().render()
效果图演示