LeakCanary初见
一、前言
在项目开发过程中,性能检测分析是必不可少的一个环节,如果自己用MAT工具分析,或者用UIAnmatior等工具分析 也是可以做到,但工欲善其事必先利其器,有一个好的工具对我们开发还是很想帮助的,能让我们把精力更多的放在代码的优化和设计上。这也正是Google一直想让我们开发者做的事情。在开源的大环境下有很多可以检测内存泄漏的手段和第三方库,今天我们就来介绍一款堪称神器的内存泄露检查工具,LeakCanary。它是一款由Square公司提供的检测内存泄漏的工具,LeakCanary使用起来非常简单,不信跟我来。
二、基本使用
我们首先在gradle中添加LeakCanary依赖,注意如果android studio3.0版本以后则需要使用debugImplementation这种依赖方式
debugImplementation'com.squareup.leakcanary:leakcanary-android:1.6.3'
releaseImplementation 'com.squareup.leakcanary:leakcanary-android-no-op:1.6.3'随后在我们的Application类中,开始启动LeakCanary
public class MyApplication extends Application {
@Override public void onCreate() {
     super.onCreate();
  if (LeakCanary.isInAnalyzerProcess(this)) {
    // This process is dedicated to LeakCanary for heap analysis.
    // You should not init your app in this process.
    return;
  }
  LeakCanary.install(this);
  }
}
并且在 Manifest中 在application节点中添加name属性,写入你自定义的Application类
当LeakCanary在调试版本中检测到你的Activity发生内存泄漏时,你的通知栏就会收到其通知提醒。为了测试一下上面的几行代码是否就真的能实现我们的需求,我们人为的写入一个一定会发生内存泄漏的代码:
public class LeakUtils {
    public static LeakUtils utils;
    private Context context;

    public LeakUtils(Context context) {
        this.context = context;
    }

    public static LeakUtils getUtils(Context context) {
        if (utils == null) {
            synchronized (LeakUtils.class) {
                if (utils == null) {
                    // 因为静态utils变量的生命周期等同程序生命周期
                    // 所以当utils持有activity的context时,会使activity始终存在着utils的强引用,导致该activity无法被销毁
                    // 解决办法1.使用context.getApplicationContext(),
                    // 2.弱引用context
                    utils = new LeakUtils(context);
                }
            }
        }
        return utils;
    }
}
private CommentUtils(Context context) {

  this.context = context;

}

}
随后在我们的类中,使用该内存泄漏的代码
public class MainActivity extends AppCompatActivity {

    @Override
    protected void onCreate(Bundle savedInstanceState) {
        super.onCreate(savedInstanceState);
        setContentView(R.layout.activity_main);

        LeakUtils utils = LeakUtils.getUtils(this);
    }
}
由于LeakCanary是在onDestroy之后才去分析GC后,是否有引用的。我们需要手动让我们的程序执行到onDestroy回调方法上,最简单的办法就是横竖屏切换,等待几秒钟(不同手机执行需要的时间不太一样),随后我们的通知栏就会出现通知:这里需要提醒下,在6.0系统以上,LeakCanary首先会发送一条通知请求权限
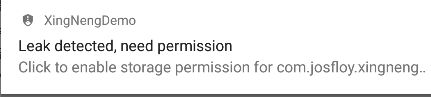
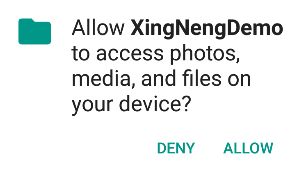
点击该通知条允许app获得权限,
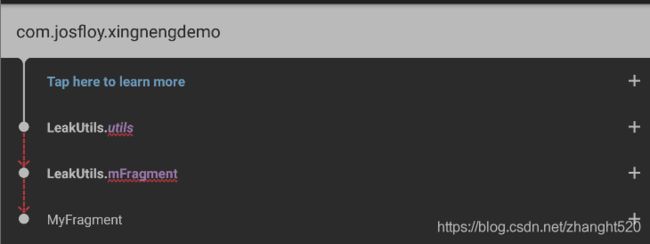
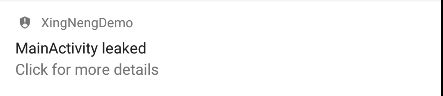
随后就能够正常接收内存泄漏的通知,点击并可以查看当前泄漏详情:
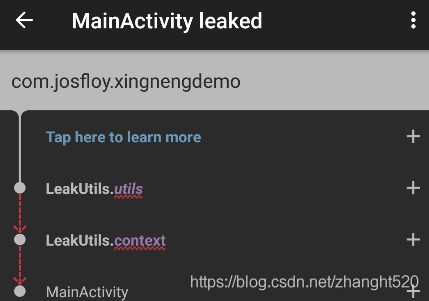
Activity的内存检测就这么简单。但是如果你需要检测Fragment就需要一个 RefWatcher来监听我们的Fragment
public class MyFragmentApplication extends Application {
    //程序运行的时候会创建一个Application 对象,且仅创建一个,
    // 而且Application 的生命周期等于程序的生命周期,所以我们所使用的refWatcher都是同一个
    private RefWatcher refWatcher;
    public static RefWatcher getRefWatcher(Context context) {
        MyFragmentApplication application = (MyFragmentApplication) context.getApplicationContext();
        return application.refWatcher;
    }
    @Override
    public void onCreate() {
        super.onCreate();
        if (LeakCanary.isInAnalyzerProcess(this)) {
            // This process is dedicated to LeakCanary for heap analysis.
            // You should not init your app in this process.
            return;
        }
        //这里比Activity多的就是获得了LeakCanary.install的值
        refWatcher = LeakCanary.install(this);
    }
}随后在我们的Fragment中,当Fragment销毁的时候,refWatcher.watch(fragment)
public class MyFragment extends Fragment {
    RefWatcher mRefWatcher;

    @Nullable
    @Override
    public View onCreateView(@NonNull LayoutInflater inflater, @Nullable ViewGroup container, @Nullable Bundle savedInstanceState) {
        View view = LayoutInflater.from(getActivity()).
                inflate(R.layout.fragment_main, container, false);
        //为了简单起见,这里我们偷懒让LeakUtils重载getUtils
        LeakUtils utils = LeakUtils.getUtils(this);
        return view;
    }

    @Override
    public void onDestroy() {
        super.onDestroy();
        mRefWatcher = MyFragmentApplication.getRefWatcher(getActivity());
        mRefWatcher.watch(this);
    }
}
然后在Activity中添加Fragment
随后信息就以通知的形式反馈给我们