基于规则嵌入的论文比对系统——创新实训记录5
6-16 关系图可视化:①论文引用了哪些论文②论文被哪些论文所引用
创新实训记录5
- 数据预处理
- 可视化
数据预处理
首先需要两个基本的数据,title对应论文标题,id_dic是论文id与索引的对应关系。
# 获取title
filepath0 = 'D:/大学资料/大三下/项目实训/code+data/ACM数据集/nodes.txt'
f0 = open(filepath0,'r')
title = []
for line in f0:
    lines = line.strip('\n')
    title.append(lines)
print(title[:3])
f0.close()

# 构建一个字典,id与list下标的对应关系
id_path = 'D:/大学资料/大三下/项目实训/code+data/ACM数据集/articles.log'
id_file = open(id_path,'r')
i = 0
id_dic = {}
for line in id_file.readlines():
    id = line.split()[1]
    id_dic[id] = i
    i +=1
print(len(id_dic))
然后就是论文之间的引用关系,前期队友对inlink.list和outlinks.list进行了预处理,生成了对应的txt文档,和ACM数据集中其他的数据形式一样,每行对应一篇论文。我们把数据分别取出到两个list中(outlinks,inlinks),outlinks中的每个元素对应一篇论文所引用的论文id,inlinks中的每个元素对应一篇论文被哪些论文所引用的id。
olinkspath = 'D:/大学资料/大三下/项目实训/code+data/ACM数据集/outlinks.txt'
ofile = open(olinkspath,'r')
outlinks = []
for line in ofile:
    lines = line.strip('\n')
    outlinks.append(lines)
print(outlinks[:3])
ofile.close()

ilinkspath = 'D:/大学资料/大三下/项目实训/code+data/ACM数据集/inlinks.txt'
ifile = open(ilinkspath,'r')
inlinks = []
for line in ifile:
    lines = line.strip('\n')
    inlinks.append(lines)
print(inlinks[0])
ifile.close()
可视化
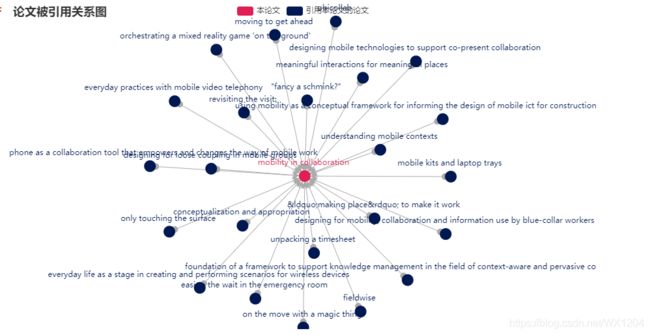
按照pyecharts说明文档,关系图需要的数据包括:GraphNode(节点数据项)、GraphLink(节点间的关系数据)和GraphCategory(节点分类类目)。我们根据论文之间的引用关系依次去构造这三个数据。
- 引用关系 即该论文引用了哪些论文
定义可视化函数:
from pyecharts import options as opts
from pyecharts.charts import Graph
from pyecharts.globals import ThemeType

# 定义可视化函数

def getCiteVis(paper_id):
    # 该论文(sourcr)的index
    sindex = id_dic[str(paper_id)]

    # node_id 是包括该论文和其引用论文id的list
    node_id = []
    node_id = outlinks[sindex].split()
    node_id.insert(0,str(paper_id))

    node_name =[]
    for i in node_id:
        name = title[id_dic[str(i)]]
        node_name.append(name)

    # 构造关系图的nodes
    nodes = []
    for name in node_name:
        temp = {}
        temp['name']=name
        temp['symbolSize'] = 20
        temp['category'] = 1
        nodes.append(temp)
    nodes[0]['category']=0

    # 构造关系图的links
    sname = node_name[0]
    links = []
    for i in nodes:
        links.append({"source":sname, "target": i.get("name")})

    # 构造关系图的categories
    categories = [{'name':'本论文'},{'name':'引用论文'}]

    c = Graph(init_opts=opts.InitOpts(theme=ThemeType.ROMA))\
        .add('',nodes=nodes, links=links, categories=categories,repulsion=1500,edge_symbol = ['circle', 'arrow'])\
        .set_global_opts(title_opts=opts.TitleOpts(title="论文引用关系图"))
    return c
调用函数:
paper_id = 156

a= getCiteVis(paper_id)
a.render_notebook()
paper_id = 157

a= getCiteVis(paper_id)
a.render_notebook()
可视化效果如下:


2. 被引用关系 即该论文被哪些论文引用
定义可视化函数:
from pyecharts import options as opts
from pyecharts.charts import Graph
from pyecharts.globals import ThemeType

# 定义可视化函数

def getCitedVis(paper_id):
    # 该论文(sourcr)的index
    sindex = id_dic[str(paper_id)]

    # node_id 是包括该论文和其引用论文id的list
    node_id = []
    node_id = inlinks[sindex].split()
    node_id.insert(0,str(paper_id))

    node_name =[]
    for i in node_id:
        name = title[id_dic[str(i)]]
        node_name.append(name)
    print(node_name)

    # 构造关系图的nodes
    nodes = []
    for name in node_name:
        temp = {}
        temp['name']=name
        temp['symbolSize'] = 20
        temp['category'] = 1
        nodes.append(temp)
    nodes[0]['category']=0

    # 构造关系图的links
    sname = node_name[0]
    links = []
    for i in nodes:
        links.append({"source":sname, "target": i.get("name")})

    # 构造关系图的categories
    categories = [{'name':'本论文'},{'name':'引用本论文的论文'}]

    c = Graph(init_opts=opts.InitOpts(theme=ThemeType.ROMA))\
        .add('',nodes=nodes, links=links, categories=categories,repulsion=1500,edge_symbol = ['arrow','circle'])\
        .set_global_opts(title_opts=opts.TitleOpts(title="论文被引用关系图"))

    return c
调用函数:
paper_id = 175
cited = getCitedVis(paper_id)
cited.render_notebook()
paper_id = 177
cited = getCitedVis(paper_id)
cited.render_notebook()

