嗨,你有一份微信好友报告待查收~
全部代码都已上传至我的KLab—嗨,你有一份微信好友报告待查收~,Fork后可运行生成你自己的微信好友报告~
本次项目统计展示了如下信息:
-
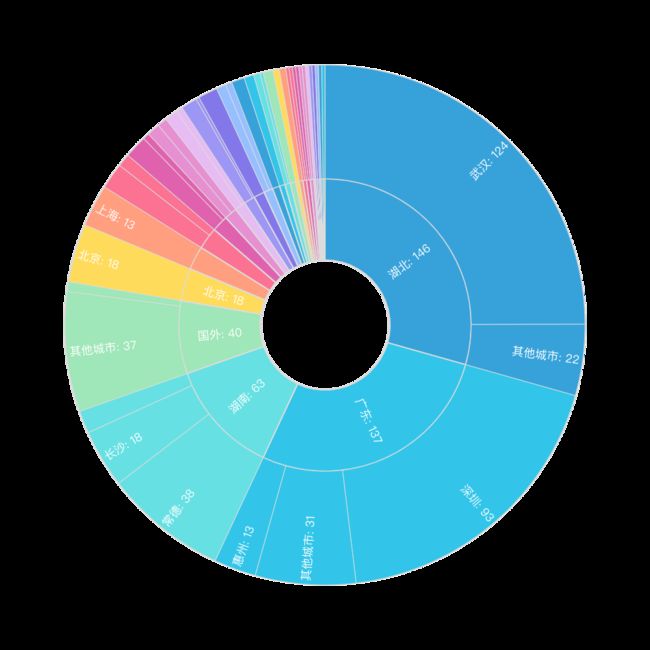
好友地域分布
-
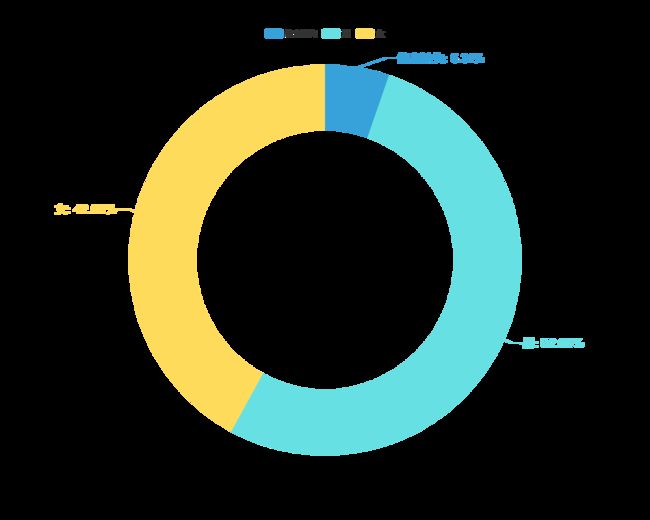
性别统计
-
备注比例
-
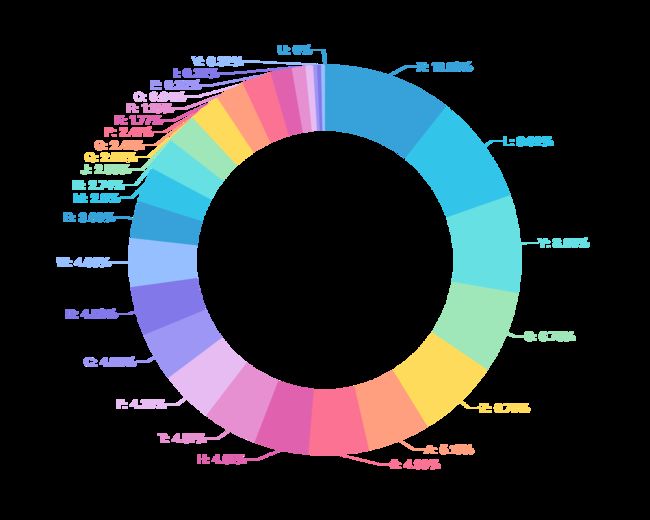
▶️首字母统计
-
使用最多的emoji
-
签名词云
其他可视化报告:
-
【武汉加油⛽️】基于Pyecharts的疫情数据可视化~
-
【爬虫&可视化】爬了链家房源信息看看深圳房价多恐怖~
-
【Pyecharts】奥运会数据集可视化分析~
-
【Pyecharts教程2】如何让你的图表不那么单调~
登录微信
因为在KLab里面没法调起其他应用来打开二维码图片,所以这边是通过多线程来处理:
-
线程1:itchat获取二维码图片,等待扫码完成;
-
线程2: 读取本地二维码图片然后通过matplotlib加载到KLab;
具体代码如下,不算复杂~
之前有小伙伴遇到不能扫码登录的,是因为微信那边做了限制,对于有些账号(特别是新注册的账号)不能在网页端登录;
code_path = os.path.join('/home/kesci/work', 'QR.png')

def show_qrcode():
    # 等待图片下载
    time.sleep(3)
    while True:
        if os.path.exists(code_path):
            img = Image.open(code_path)
            plt.figure(figsize=(15, 8))
            plt.imshow(img)
            plt.axis('off') # 关掉坐标轴为 off
            plt.show()
            break


t= threading.Thread(target=show_qrcode)#创建线程
t.setDaemon(True)#设置为后台线程,这里默认是False,设置为True之后则主线程不用等待子线程
t.start()#开启线程

t = threading.Thread(target=itchat.login(picDir=code_path))
t.start()
地域分布
微信返回的好友信息中包括了Province和City两个字段,不过有亮点要注意的:
-
对于北京等四个直辖市,
Province中是存的城市名,City中是行政区; -
另外地域信息是国外的我这边是都归到一类下面了,二级分类用的
Province的信息;
数据处理
friends = itchat.get_friends(update=True)
df_friends = pd.DataFrame(list(friends))

f_loc = df_friends.groupby(
    ['Province', 'City'])['UserName'].count().reset_index()
# 筛选掉位置信息缺失的
f_loc = f_loc[f_loc.Province != '']

for idx, row in f_loc.iterrows():
    # 位置信息缺失的归到其他中
    if not row.Province:
        f_loc.loc[idx, 'Province'] = '其他'
        f_loc.loc[idx, 'City'] = '其他'
    # 国外的统一归到一类
    if re.match('[a-zA-Z]', row.Province):
        f_loc.loc[idx, 'Province'] = '国外'
        f_loc.loc[idx, 'City'] = row['Province']

# 四个直辖市City中是行政区
f_loc['City'].loc[f_loc.Province == '北京'] = '北京'
f_loc['City'].loc[f_loc.Province == '上海'] = '上海'
f_loc['City'].loc[f_loc.Province == '重庆'] = '重庆'
f_loc['City'].loc[f_loc.Province == '天津'] = '天津'

# 重新聚合求和
f_loc = f_loc.groupby(['Province', 'City'])['UserName'].sum().reset_index()
f_loc.columns = ['Province', 'City', 'num']

data_pair = []

parent_data = f_loc.Province.unique().tolist()
for province in parent_data:
    t_data = f_loc[f_loc.Province==province]
    t_dict = {"name": province,
              "label":{"show": False},
		      "children": []}
    # 父层级--好友数量大于15的显示标签
    if t_data.num.sum() > 15:
        t_dict['label']['show'] = True


    t_data.sort_values(by="num",ascending=False,inplace=True)
    t_data = t_data.reset_index(drop=True)

    else_num = 0
    for idx, row in t_data.iterrows():
        """
        因为涉及到的城市过多,全部显示太乱了
        以下两种情况下显示,否则将归入「其他城市」
        1. 每个父目录下好友最多的城市;
        2. 该城市好友数量大于10;
        """
        if idx == 0:
            child_data = {"name": row.City, "value":row.num, "label":{"show": False}}
            # 子层级--好友数量大于10的显示标签
            if child_data['value'] > 10:
                child_data['label']['show'] = True
            t_dict['children'].append(child_data)
        elif row.num > 10:
            child_data = {"name": row.City, "value":row.num, "label":{"show": True}}
            t_dict['children'].append(child_data)
        else:
            else_num += row.num


    if else_num > 10:
        child_data = {"name": '其他城市', "value":else_num, "label":{"show": True}}
        t_dict['children'].append(child_data)
    elif else_num:
        child_data = {"name": '其他城市', "value":else_num, "label":{"show": False}}
        t_dict['children'].append(child_data)

    data_pair.append(t_dict)
可视化
c = (Sunburst(
        init_opts=opts.InitOpts(
            theme='light',
            width="1000px",
            height="1000px"))
    .add(
        "",
        data_pair=data_pair,
        highlight_policy="ancestor",
        radius=[0, "100%"],
        sort_='null',
        levels=[
            {},
            {
                "r0": "20%",
                "r": "45%",
                "itemStyle": {"borderColor": 'rgb(220,220,220)', "borderWidth": 2}
            },
            {"r0": "45%", "r": "80%", "label": {"align": "right"},
                "itemStyle": {"borderColor": 'rgb(220,220,220)', "borderWidth": 1}}
        ],
    )
    .set_global_opts(title_opts=opts.TitleOpts(title="好 友\n\n地 域 分 布",
                                               pos_left="center",
                                               pos_top="center",
                                               title_textstyle_opts=opts.TextStyleOpts(font_style='oblique', color="black", font_size=30),))
    .set_series_opts(label_opts=opts.LabelOpts(font_size=18, formatter="{b}: {c}"))
)

c.render_notebook()
好友性别占比
f_sex = df_friends.groupby(['Sex'])['UserName'].count().reset_index()
f_sex['f_sex'] = f_sex['Sex'].astype(str).str.replace('1', '男').replace('2', '女').replace('0', '信息缺失')

background_color_js = """new echarts.graphic.RadialGradient(0.5, 0.5, 1, [{
                                        offset: 0,
                                        color: '#696969'
                                    }, {
                                        offset: 1,
                                        color: '#000000'
                                    }])"""


pie = (Pie(init_opts=opts.InitOpts(theme='light', width='1000px', height='800px'))
       .add('WeChat️', [(row['f_sex'], row['UserName']) for _, row in f_sex.iterrows()],
            radius=["50%", "75%"])
       .set_global_opts(title_opts=opts.TitleOpts(title="好友性别占比",
                                                  pos_left="center",
                                                  title_textstyle_opts=opts.TextStyleOpts(color="black", font_size=20),     ),
                        legend_opts=opts.LegendOpts(is_show=True, pos_top='5%'))
       .set_series_opts(label_opts=opts.LabelOpts(formatter="{b}: {d}%", font_size=18),
                        tooltip_opts=opts.TooltipOpts(trigger="item", formatter="{a}
{b}: {c} ({d}%)"),)
      )
pie.render_notebook()
好友备注比例
你有给好友备注的习惯吗❓
remark_num_f = len(df_friends.RemarkName[(
    df_friends.RemarkName != '') & (df_friends.Sex == 2)])
total_num_f = len(df_friends.RemarkName[(df_friends.Sex == 2)])

remark_num_m = len(df_friends.RemarkName[(
    df_friends.RemarkName != '') & (df_friends.Sex == 1)])
total_num_m = len(df_friends.RemarkName[(df_friends.Sex == 1)])

l1 = Liquid(
    init_opts=opts.InitOpts(
        theme='light',
        width='1000px',
        height='800px'))
l1.add("", [remark_num_f/total_num_f],
       center=["70%", "50%"],
       label_opts=opts.LabelOpts(font_size=50,
                                 formatter=JsCode(
                                     """function (param) {
                            return (Math.floor(param.value * 10000) / 100) + '%';
                        }"""),
                                 position="inside",
                                 ))
l1.set_global_opts(
    title_opts=opts.TitleOpts(
        title="女性好友备注比例",
        pos_left='62%',
        pos_top='8%'))
l1.set_series_opts(tooltip_opts=opts.TooltipOpts(is_show=False))

l2 = Liquid(
    init_opts=opts.InitOpts(
        theme='light',
        width='1000px',
        height='800px'))
l2.add("",
       [remark_num_m/total_num_m],
       center=["25%", "50%"],
       label_opts=opts.LabelOpts(font_size=50,
                                 formatter=JsCode(
                                     """function (param) {
                        return (Math.floor(param.value * 10000) / 100) + '%';
                    }"""),
                                 position="inside",
                                 ),)
l2.set_global_opts(
    title_opts=opts.TitleOpts(
        title="男性好友备注比例",
        pos_left='16%',
        pos_top='8%'))
l2.set_series_opts(tooltip_opts=opts.TooltipOpts(is_show=False))


grid = Grid().add(
    l1, grid_opts=opts.GridOpts()).add(
        l2, grid_opts=opts.GridOpts())
grid.render_notebook()
首字母分布
这个统计与微信-联系人里面的归类有点不一样,微信-联系人里面是优先使用备注名的,这里只与好友的微信昵称有关;
first_letter = []
for item in df_friends.PYQuanPin:
    # 替换掉emoji表情和空格
    item = re.sub('spanclassemojiemoji[a-z0-9]{5}?|span', '' , item)

    try:
        if re.match('[A-Z]', item.upper()[0]):
            first_letter.append(item.upper()[0])
        else:
            first_letter.append('#')
    except IndexError:
        first_letter.append('#')


letters = [chr(i) for i in range(65,91)]
letters.append('#')
data_pair = [(w, first_letter.count(w)) for w in letters]
data_pair = sorted(data_pair, key=lambda x: x[1], reverse=True)

pie = (Pie(init_opts=opts.InitOpts(theme='light', width='1000px', height='800px'))
       .add("Wechat", data_pair,
            radius=["50%", "75%"])
       .set_global_opts(title_opts=opts.TitleOpts(title="微信名首字母",
                                                  pos_left="center",
                                                  title_textstyle_opts=opts.TextStyleOpts(color="black", font_size=20),),
                        legend_opts=opts.LegendOpts(is_show=False, pos_top='5%'))
       .set_series_opts(label_opts=opts.LabelOpts(formatter="{b}: {d}%", font_size=18),
                        tooltip_opts=opts.TooltipOpts(trigger="item", formatter="{a}
{b}: {c} ({d}%)"),)
                        )

pie.render_notebook()
Emoji表情
包括了微信昵称和签名中的emoji表情~
emoji_list = []
for name in df_friends.NickName:
    emoji = re.findall(u'[\U00010000-\U0010ffff]', name)
    if emoji:
        emoji_list.extend(emoji)

with open('/home/kesci/input/emoji6441/emoji.json', 'r') as f:
    emoji_code = json.load(f)

def find_emoji(code):
    for item in emoji_code:
        if item['codes'] == code.upper():
            return item['char']
            break

for sig in df_friends.Signature:
    emoji = re.findall('emoji([a-z0-9]{5})', sig)

    if emoji:
        emoji = [find_emoji(code) for code in emoji]
        emoji_list.extend(emoji)


counter = Counter(emoji_list).most_common(18)

bar = (Bar(init_opts=opts.InitOpts(theme='light', width='1000px', height='800px'))
       .add_xaxis([x for x, y in counter[::-1]])
       .add_yaxis('使用次数', [y for x, y in counter[::-1]])
       .set_global_opts(title_opts=opts.TitleOpts(title="使用最多的emoji表情",
                                                  pos_left="center",
                                                  title_textstyle_opts=opts.TextStyleOpts(color="black",
                                                                                          font_size=20)),
                        legend_opts=opts.LegendOpts(is_show=False),
                        xaxis_opts=opts.AxisOpts(is_show=False,),
                        yaxis_opts=opts.AxisOpts(
           axistick_opts=opts.AxisTickOpts(is_show=False),
           axisline_opts=opts.AxisLineOpts(is_show=False)))
       .set_series_opts(label_opts=opts.LabelOpts(is_show=True,
                                                  position='right',
                                                  font_style='italic'),
                        itemstyle_opts={"normal": {
                            "color": JsCode(
                                """new echarts.graphic.LinearGradient(1, 1, 0, 0, [{
                                                offset: 0,
                                                color: 'rgba(0, 244, 255, 1)'
                                            }, {
                                                offset: 1,
                                                color: 'rgba(0, 77, 167, 1)'
                                            }], false)"""
                            ),
                            "barBorderRadius": [30, 30, 30, 30],
                            "shadowColor": "rgb(0, 160, 221)",
                        }
       }
).reversal_axis())

bar.render_notebook()
签名词云图
签名说的最多的词语是什么呢❓
back_color = imread('/home/kesci/work/font/wechat_logo.jpeg')  # 解析该图片
wc = WordCloud(background_color='white',  # 背景颜色
               max_words=1000,  # 最大词数
               mask=back_color,  # 以该参数值作图绘制词云,这个参数不为空时,width和height会被忽略
               max_font_size=100,  # 显示字体的最大值
               font_path="/home/kesci/work/font/simhei.ttf",  # 解决显示口字型乱码问题
               random_state=42,  # 为每个词返回一个PIL颜色
               )

text=''
pattern = u"[\u4e00-\u9fa5]" #保留汉字
for x in df_friends['Signature']:
    text_temp =  re.findall(pattern, x)
    text = text + ''.join(text_temp)

def word_cloud(texts):
    words_list = []
    word_generator = jieba.cut(texts, cut_all=False)  # 返回的是一个迭代器
    for word in word_generator:
        if len(word) > 1:  #去掉单字
            words_list.append(word)
    return ' '.join(words_list)


text = word_cloud(text)

wc.generate(text)
# 基于彩色图像生成相应彩色
image_colors = ImageColorGenerator(back_color)
plt.figure(figsize = (15,15))
plt.axis('off')
# 绘制词云
plt.imshow(wc.recolor(color_func=image_colors))
plt.axis('off')
# 保存图片
plt.show()
- 整理不易,欢迎大家点赞支持~


