【Matlab】正态分布常用函数normpdf_normcdf_norminv_normrnd_normfit
1.normpdf
功能:正态分布概率密度函数
用法
Y = normpdf(X,mu,sigma)
Y = normpdf(X) %  (mu = 0, sigma = 1)
Y = normpdf(X,mu) % (sigma = 1)
例子
% code1
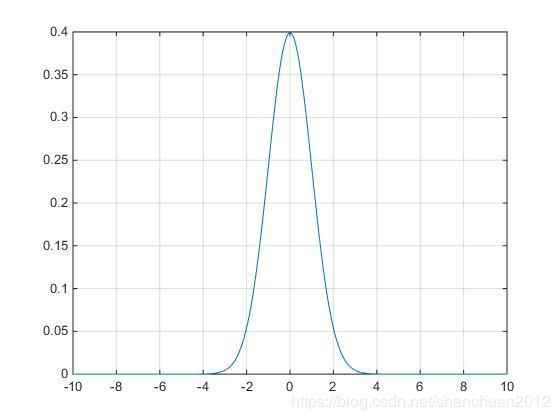
% 画标准正态分布概率密度函数
x = -10:0.01:10;
y = normpdf(x, 0, 1);
plot(x,y);
grid on;
结果:
自己写一个正态分布概率密度函数
% code2
% 画正态分布概率密度函数
% 写成了函数
function [] = normal_distribution()
x = -10:0.01:10;
y = fx(x, 0, 1); % 自写函数
plot(x,y);
grid on;

% 概率密度函数
function f = fx(x, miu, sig)
f = (sqrt(2*pi)*sig).^(-1) * exp(-(x-miu).^2/(2*sig*sig));
结果:
2.normcdf
功能:正态分布函数
用法
p = normcdf(x) % 标准正态分布
p = normcdf(x,mu,sigma)
例子
% code3
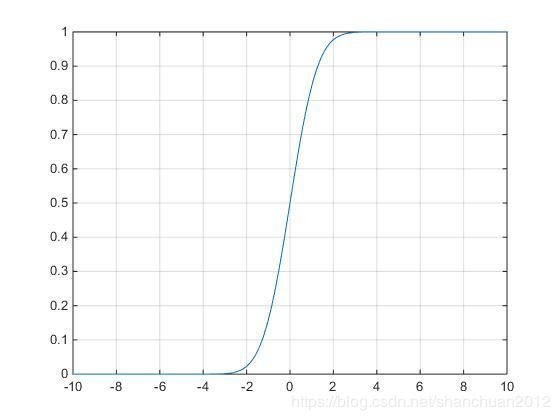
% 画正态分布函数
x = -10:0.01:10;
y = normcdf(x, 0, 1);
plot(x,y);
grid on;
结果:
3.norminv
功能:正态分布分位数
用法
X = norminv(P,mu,sigma)
例子
分位数的意思就是,如有:
P { X ≥ x α } = α P\{X \geq x_{\alpha} \} = \alpha P{X≥xα}=α
则称 x α x_{\alpha} xα为 X X X的上侧 α \alpha α分位数。
norminv(1-0.05,0,1)
结果:1.6449
4.normrnd
功能:生成正态随机数
用法:
R = normrnd(mu,sigma)         % 生成一个数
R = normrnd(mu,sigma,m,n,...) % 生成m*n列向量
例子:
>> normrnd(0,1)
ans =
    1.4122
>> normrnd(0,1,5,3)
ans =
    0.0226    0.9199   -0.7777
   -0.0479    0.1498    0.5667
    1.7013    1.4049   -1.3826
   -0.5097    1.0341    0.2445
   -0.0029    0.2916    0.8084
5.normfit
功能:正态分布参数估计
用法
[muhat,sigmahat] = normfit(data)                    % 点估计mu和sigma
[muhat,sigmahat,muci,sigmaci] = normfit(data)		% 区间估计,默认置信度95%
[muhat,sigmahat,muci,sigmaci] = normfit(data,alpha) % 置信度100(1 - alpha) %
例子:
>> r=normrnd(0,1,100,2); 		 % 生成100*2和标准正态分布
>> [muhat,sigmahat] = normfit(r) % 点估计mu和sigma
muhat =
   -0.1214   -0.1076
sigmahat =
    0.9723    1.0072

>> [muhat,sigmahat,muci,sigmaci] = normfit(r) % 区间估计,默认置信度95%
muhat =                  % 点估计
   -0.1214   -0.1076
sigmahat =
    0.9723    1.0072
muci =
   -0.3143   -0.3074
    0.0715    0.0923
sigmaci =                % 区间估计
    0.8537    0.8843
    1.1295    1.1701

>> [muhat,sigmahat,muci,sigmaci] = normfit(r,0.05) % 置信度100(1 - alpha) %
muhat =                  % 点估计
   -0.1214   -0.1076
sigmahat =
    0.9723    1.0072
muci =                    % 区间估计
   -0.3143   -0.3074
    0.0715    0.0923
sigmaci =
    0.8537    0.8843
    1.1295    1.1701


